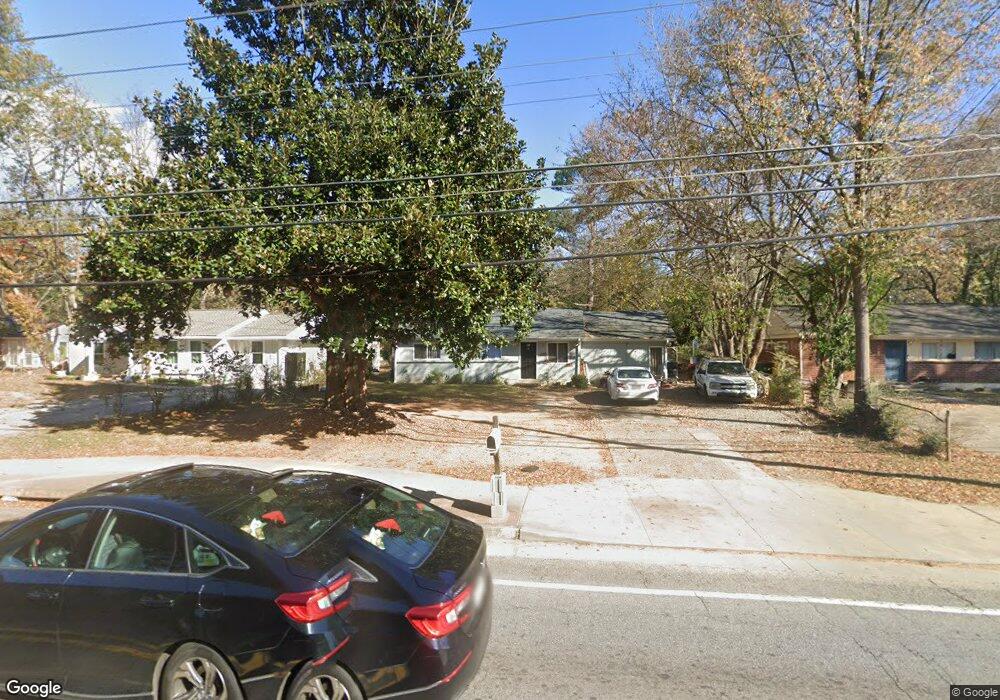
4773 Winters Chapel Rd Atlanta, GA 30360
Estimated Value: $291,000 - $331,000
4
Beds
1
Bath
1,335
Sq Ft
$233/Sq Ft
Est. Value
About This Home
This home is located at 4773 Winters Chapel Rd, Atlanta, GA 30360 and is currently estimated at $310,405, approximately $232 per square foot. 4773 Winters Chapel Rd is a home located in Gwinnett County with nearby schools including Susan Stripling Elementary School, Pinckneyville Middle School, and Paul Duke STEM High School.
Ownership History
Date
Name
Owned For
Owner Type
Purchase Details
Closed on
Sep 15, 2016
Bought by
Thomas Soren S
Current Estimated Value
Purchase Details
Closed on
Jun 30, 2010
Sold by
Berman Barbara
Bought by
Booval Llc
Purchase Details
Closed on
Jan 31, 2006
Sold by
Flannery Colin
Bought by
Flannery Colin and Berman Barbara
Home Financials for this Owner
Home Financials are based on the most recent Mortgage that was taken out on this home.
Original Mortgage
$87,200
Interest Rate
6.21%
Mortgage Type
New Conventional
Purchase Details
Closed on
Jan 6, 2006
Sold by
Robinson Donald G and Robinson Brenda G
Bought by
Jones Jerome E
Home Financials for this Owner
Home Financials are based on the most recent Mortgage that was taken out on this home.
Original Mortgage
$87,200
Interest Rate
6.21%
Mortgage Type
New Conventional
Create a Home Valuation Report for This Property
The Home Valuation Report is an in-depth analysis detailing your home's value as well as a comparison with similar homes in the area
Home Values in the Area
Average Home Value in this Area
Purchase History
| Date | Buyer | Sale Price | Title Company |
|---|---|---|---|
| Thomas Soren S | $117,000 | -- | |
| Booval Llc | -- | -- | |
| Flannery Colin | -- | -- | |
| Flannery Colin | $109,000 | -- | |
| Jones Jerome E | $90,000 | -- |
Source: Public Records
Mortgage History
| Date | Status | Borrower | Loan Amount |
|---|---|---|---|
| Previous Owner | Flannery Colin | $87,200 |
Source: Public Records
Tax History Compared to Growth
Tax History
| Year | Tax Paid | Tax Assessment Tax Assessment Total Assessment is a certain percentage of the fair market value that is determined by local assessors to be the total taxable value of land and additions on the property. | Land | Improvement |
|---|---|---|---|---|
| 2025 | -- | $98,760 | $25,840 | $72,920 |
| 2024 | $4,417 | $118,040 | $23,200 | $94,840 |
| 2023 | $4,417 | $118,040 | $23,200 | $94,840 |
| 2022 | $3,751 | $98,280 | $18,400 | $79,880 |
| 2021 | $2,731 | $68,600 | $13,200 | $55,400 |
| 2020 | $2,731 | $68,600 | $13,200 | $55,400 |
| 2019 | $1,721 | $68,600 | $13,200 | $55,400 |
| 2018 | $1,722 | $42,280 | $8,800 | $33,480 |
| 2016 | $1,348 | $32,720 | $8,800 | $23,920 |
| 2015 | $1,363 | $32,720 | $8,800 | $23,920 |
| 2014 | $1,232 | $32,720 | $8,800 | $23,920 |
Source: Public Records
Map
Nearby Homes
- 3225 Spring Dr
- 2924 Winter Rose Ct
- 2975 Wintercrest Trace
- 2928 Wintercrest Way
- 7082 Murphy Joy Ln NW
- 4846 Twin Lakes Trail
- 4514 Redwood St
- 3057 Four Oaks Dr
- 2805 Homeland Dr
- 2659 Amberly Dr Unit 18
- 2611 Briers Dr N
- 2631 Holliston Ct
- 2608 Laurelwood Rd
- 4610 Brierwood Place
- 3931 Virginia Ave
- 5052 Glaze Dr
- 2624 E Madison Dr
- 3425 September Morn
- 2511 Cherry Hill Ln
- 5145 Joel Ct
- 4779 Winters Chapel Rd
- 4769 Winters Chapel Rd
- 4763 Winters Chapel Rd
- 2480 Scarlett Aly
- 0 Winters Chapel Rd Unit 7009695
- LOT 1 Adams Parc
- 2451 Avery Unit n/a
- 2587 Windward Ct
- 0 Winters Chapel Rd Unit 4101144
- Lot 3 Dunwoody Club Dr
- Lot 2 Dunwoody Club Dr
- Lot 1 Dunwoody Club Dr
- 803 Tilly Mill Rd Unit 803
- 2539 Avery Unit 2539
- 2451 Avery
- 2432 Avery
- 4751 Tilly
- 2432 Avery
- 2292 White Spruce Aly Unit 190
- 2997 Ramble Ln