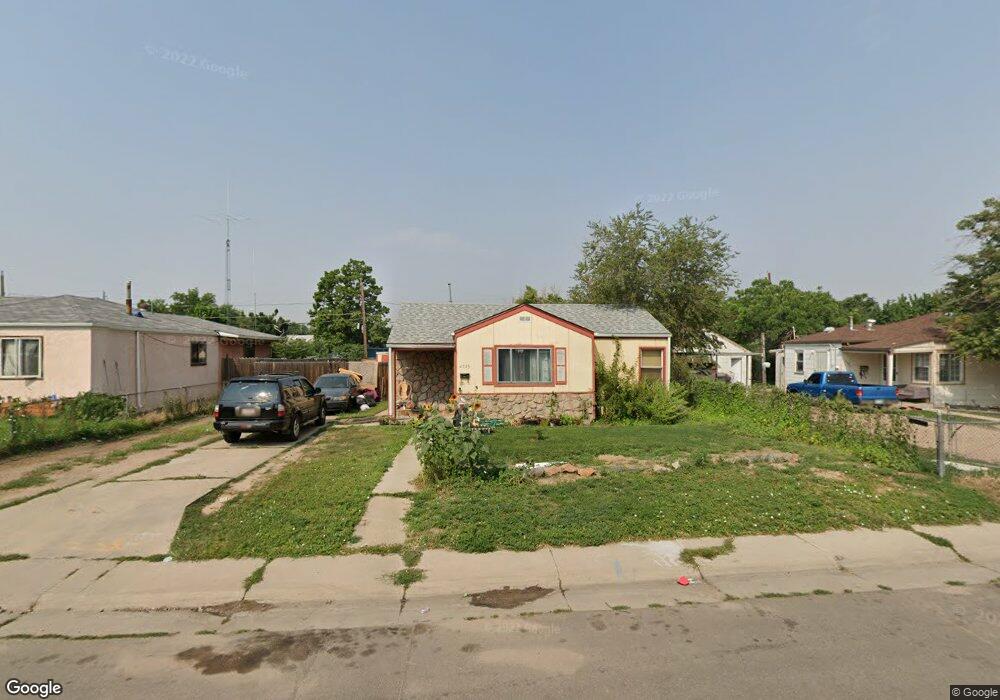
4775 Fillmore St Denver, CO 80216
Elyria-Swansea NeighborhoodEstimated Value: $301,560 - $370,000
2
Beds
1
Bath
657
Sq Ft
$514/Sq Ft
Est. Value
About This Home
This home is located at 4775 Fillmore St, Denver, CO 80216 and is currently estimated at $337,640, approximately $513 per square foot. 4775 Fillmore St is a home located in Denver County with nearby schools including Swansea Elementary School, Whittier ECE-8 School, and Bruce Randolph School.
Ownership History
Date
Name
Owned For
Owner Type
Purchase Details
Closed on
Nov 4, 2010
Sold by
Origin Holdings Llc
Bought by
Carrigan Michael
Current Estimated Value
Home Financials for this Owner
Home Financials are based on the most recent Mortgage that was taken out on this home.
Original Mortgage
$79,600
Outstanding Balance
$52,759
Interest Rate
4.36%
Mortgage Type
New Conventional
Estimated Equity
$284,881
Purchase Details
Closed on
Oct 23, 2009
Sold by
Denver Residential Holdings Llc
Bought by
Origin Holdings Llc
Purchase Details
Closed on
Sep 28, 2009
Sold by
Milan Balente and Milan Stella Rachael
Bought by
Denver Residential Holdings Llc
Purchase Details
Closed on
Aug 12, 2002
Sold by
Milan Stella Rachael
Bought by
Milan Balente and Milan Stella Rachael
Home Financials for this Owner
Home Financials are based on the most recent Mortgage that was taken out on this home.
Original Mortgage
$109,600
Interest Rate
7.4%
Create a Home Valuation Report for This Property
The Home Valuation Report is an in-depth analysis detailing your home's value as well as a comparison with similar homes in the area
Home Values in the Area
Average Home Value in this Area
Purchase History
| Date | Buyer | Sale Price | Title Company |
|---|---|---|---|
| Carrigan Michael | $79,600 | Fita | |
| Origin Holdings Llc | $73,000 | None Available | |
| Denver Residential Holdings Llc | -- | None Available | |
| Milan Balente | -- | -- | |
| Milan Stella Rachael | -- | American Escrow Title Llc |
Source: Public Records
Mortgage History
| Date | Status | Borrower | Loan Amount |
|---|---|---|---|
| Open | Carrigan Michael | $79,600 | |
| Previous Owner | Milan Balente | $109,600 |
Source: Public Records
Tax History Compared to Growth
Tax History
| Year | Tax Paid | Tax Assessment Tax Assessment Total Assessment is a certain percentage of the fair market value that is determined by local assessors to be the total taxable value of land and additions on the property. | Land | Improvement |
|---|---|---|---|---|
| 2024 | $1,525 | $19,250 | $3,490 | $15,760 |
| 2023 | $1,492 | $19,250 | $3,490 | $15,760 |
| 2022 | $1,357 | $17,060 | $7,440 | $9,620 |
| 2021 | $1,310 | $17,560 | $7,660 | $9,900 |
| 2020 | $1,574 | $21,210 | $5,110 | $16,100 |
| 2019 | $1,530 | $21,210 | $5,110 | $16,100 |
| 2018 | $1,124 | $14,530 | $2,570 | $11,960 |
| 2017 | $1,121 | $14,530 | $2,570 | $11,960 |
| 2016 | $860 | $10,550 | $2,277 | $8,273 |
| 2015 | $824 | $10,550 | $2,277 | $8,273 |
| 2014 | $565 | $6,800 | $1,329 | $5,471 |
Source: Public Records
Map
Nearby Homes
- 4780 Milwaukee St
- 4807 Clayton St
- 4621 N Vasquez Blvd
- 4525 Milwaukee St Unit 2242-21-016
- 4975 Saint Paul St
- 4647 Josephine St
- 4447 Thompson Ct
- 4400 Clayton St
- 4507 Josephine St
- 4320 Clayton St
- 5123 Milwaukee St
- 4329 Steele St
- 4768 Vine St Unit 4770
- 4768 Vine St Unit 4768-4770
- 5147 Saint Paul St
- 4790 Vine St
- 4774 Vine St
- 4751 Vine St
- 4666 Race St
- 4650 Race St
- 4773 Fillmore St
- 4785 Fillmore St
- 4765 Fillmore St
- 4780 Fillmore St
- 4776 Fillmore St
- 4795 Fillmore St
- 4790 Fillmore St
- 4755 Fillmore St
- 4766 Fillmore St
- 4796 Fillmore St
- 4760 Fillmore St
- 4745 Fillmore St
- 4780 Clayton St
- 4778 Clayton St
- 4760 Clayton St
- 4750 Clayton St
- 4750 Fillmore St
- 4786 Clayton St
- 4801 Fillmore St
- 4735 Fillmore St