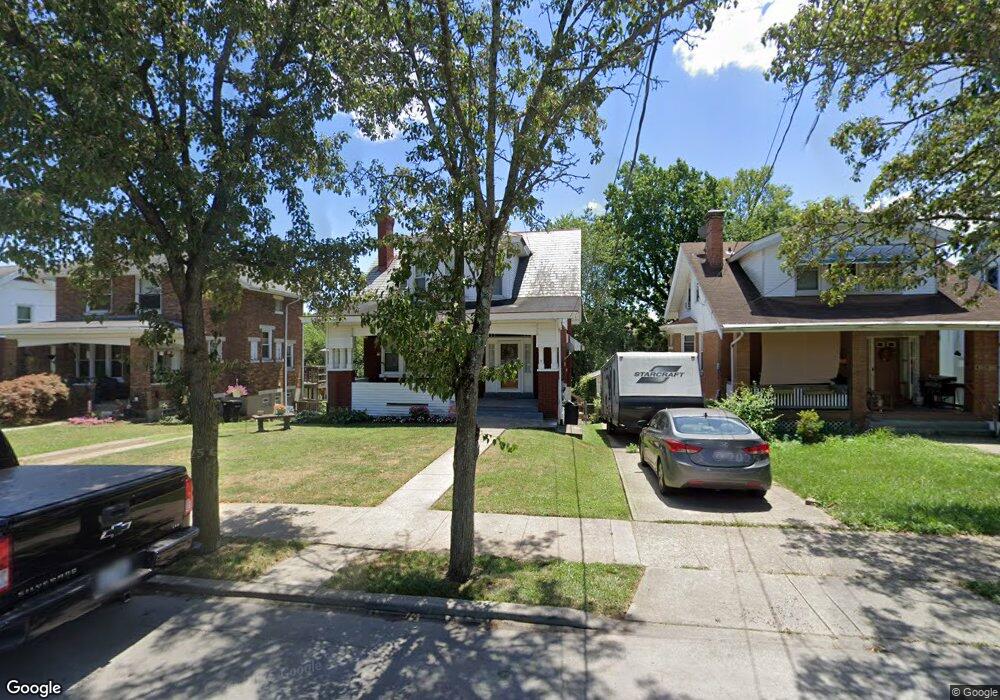
4775 Highridge Ave Cincinnati, OH 45238
West Price Hill NeighborhoodEstimated Value: $129,000 - $187,670
2
Beds
2
Baths
2,005
Sq Ft
$83/Sq Ft
Est. Value
About This Home
This home is located at 4775 Highridge Ave, Cincinnati, OH 45238 and is currently estimated at $166,918, approximately $83 per square foot. 4775 Highridge Ave is a home located in Hamilton County with nearby schools including Carson School, Gilbert A. Dater High School, and Western Hills High School.
Ownership History
Date
Name
Owned For
Owner Type
Purchase Details
Closed on
Oct 16, 2009
Sold by
The Bank Of New York Mellon
Bought by
Wilson Lori
Current Estimated Value
Purchase Details
Closed on
Sep 18, 2009
Sold by
Bauer Russell
Bought by
The Bank Of New York Mellon and The Bank Of New York
Purchase Details
Closed on
Oct 4, 2005
Sold by
Ladow Margaret
Bought by
Bauer Russell
Home Financials for this Owner
Home Financials are based on the most recent Mortgage that was taken out on this home.
Original Mortgage
$70,320
Interest Rate
5.8%
Mortgage Type
Fannie Mae Freddie Mac
Create a Home Valuation Report for This Property
The Home Valuation Report is an in-depth analysis detailing your home's value as well as a comparison with similar homes in the area
Home Values in the Area
Average Home Value in this Area
Purchase History
| Date | Buyer | Sale Price | Title Company |
|---|---|---|---|
| Wilson Lori | $60,000 | Attorney | |
| The Bank Of New York Mellon | $54,000 | Attorney | |
| Bauer Russell | $87,900 | First Title Agency Inc |
Source: Public Records
Mortgage History
| Date | Status | Borrower | Loan Amount |
|---|---|---|---|
| Previous Owner | Bauer Russell | $70,320 |
Source: Public Records
Tax History
| Year | Tax Paid | Tax Assessment Tax Assessment Total Assessment is a certain percentage of the fair market value that is determined by local assessors to be the total taxable value of land and additions on the property. | Land | Improvement |
|---|---|---|---|---|
| 2025 | $2,642 | $42,743 | $5,534 | $37,209 |
| 2024 | $2,562 | $42,743 | $5,534 | $37,209 |
| 2023 | $2,619 | $42,743 | $5,534 | $37,209 |
| 2022 | $1,458 | $21,242 | $5,499 | $15,743 |
| 2021 | $1,400 | $21,242 | $5,499 | $15,743 |
| 2020 | $1,441 | $21,242 | $5,499 | $15,743 |
| 2019 | $1,432 | $19,310 | $4,998 | $14,312 |
| 2018 | $1,434 | $19,310 | $4,998 | $14,312 |
| 2017 | $1,362 | $19,310 | $4,998 | $14,312 |
| 2016 | $1,322 | $18,480 | $5,341 | $13,139 |
| 2015 | $1,193 | $18,480 | $5,341 | $13,139 |
| 2014 | $1,201 | $18,480 | $5,341 | $13,139 |
| 2013 | $1,387 | $21,000 | $6,069 | $14,931 |
Source: Public Records
Map
Nearby Homes
- 4764 Dale Ave
- 1086 Benz Ave
- 815 Pedretti Ave
- 1059 Lockman Ave
- 4458 W 8th St
- 4419 Ridgeview Ave
- 4758 Glenway Ave
- 1092 Morado Dr
- 4526 Clearview Ave
- 4340 Eighth St W
- 4614 Midland Ave
- 4334 W 8th St
- 4318 Eighth St W
- 1026 Schiff Ave
- 4965 Glenway Ave
- 1141 Covedale Ave
- 4330 Schulte Dr
- 600 Overlook Ave
- 4261 Eighth St W
- 4247 Eighth St W
- 4771 Highridge Ave
- 4779 Highridge Ave
- 4767 Highridge Ave
- 4781 Highridge Ave
- 4770 Dale Ave
- 4768 Dale Ave
- 4778 Dale Ave
- 4766 Dale Ave
- 4757 Highridge Ave
- 4782 Dale Ave
- 4774 Highridge Ave
- 4770 Highridge Ave
- 4776 Highridge Ave
- 4762 Dale Ave
- 4755 Highridge Ave
- 1034 Overlook Ave
- 1038 Overlook Ave
- 1038 Overlook Ave Unit 1
- 1038 Overlook Ave Unit 3
- 1030 Overlook Ave
Your Personal Tour Guide
Ask me questions while you tour the home.