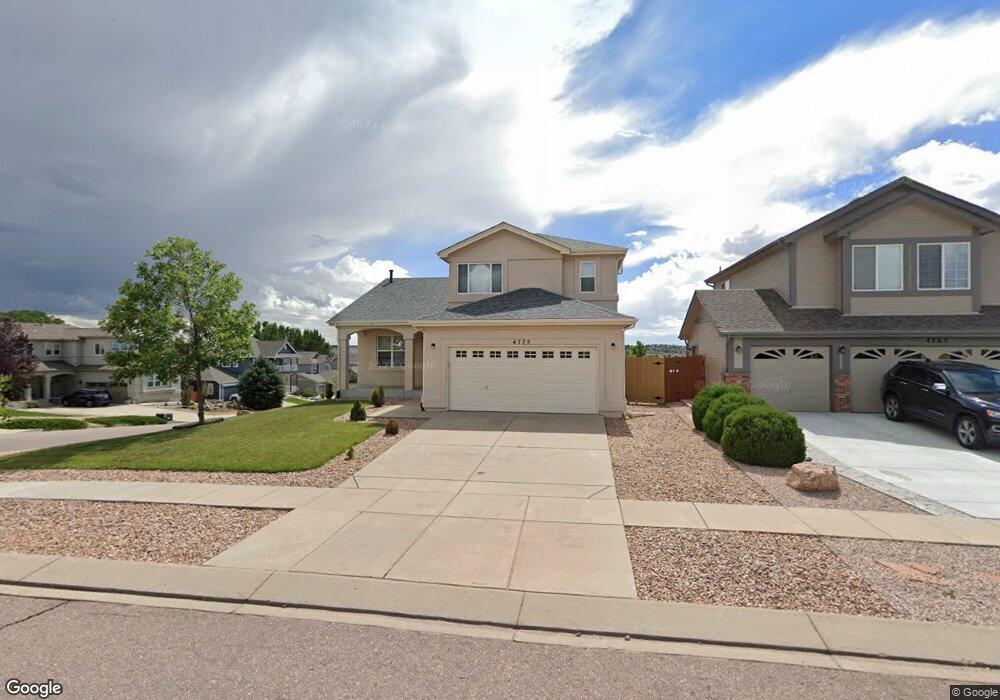
4775 Pascal Ct Colorado Springs, CO 80920
Briargate NeighborhoodEstimated Value: $512,399 - $578,000
3
Beds
3
Baths
1,729
Sq Ft
$316/Sq Ft
Est. Value
About This Home
This home is located at 4775 Pascal Ct, Colorado Springs, CO 80920 and is currently estimated at $545,600, approximately $315 per square foot. 4775 Pascal Ct is a home located in El Paso County with nearby schools including Prairie Hills Elementary School, Timberview Middle School, and Liberty High School.
Ownership History
Date
Name
Owned For
Owner Type
Purchase Details
Closed on
Dec 23, 2019
Sold by
Chapman Sharon Denise
Bought by
Schenkman Jennifer
Current Estimated Value
Home Financials for this Owner
Home Financials are based on the most recent Mortgage that was taken out on this home.
Original Mortgage
$345,186
Outstanding Balance
$304,451
Interest Rate
3.62%
Mortgage Type
FHA
Estimated Equity
$241,149
Purchase Details
Closed on
Jul 25, 2019
Sold by
Lsc Properties Inc
Bought by
Chapman Sharon Larry
Purchase Details
Closed on
Mar 30, 2016
Sold by
Holt Kim and Holt Jonathan M
Bought by
Lsc Properties Inc
Purchase Details
Closed on
May 20, 2005
Sold by
Lennar Colorado Llc
Bought by
Holt Kim and Holt Jonathan M
Home Financials for this Owner
Home Financials are based on the most recent Mortgage that was taken out on this home.
Original Mortgage
$218,450
Interest Rate
6%
Mortgage Type
New Conventional
Create a Home Valuation Report for This Property
The Home Valuation Report is an in-depth analysis detailing your home's value as well as a comparison with similar homes in the area
Home Values in the Area
Average Home Value in this Area
Purchase History
| Date | Buyer | Sale Price | Title Company |
|---|---|---|---|
| Schenkman Jennifer | $374,000 | Land Title Guarantee Company | |
| Chapman Sharon Larry | -- | None Available | |
| Lsc Properties Inc | $300,000 | Heritage Title | |
| Holt Kim | $273,093 | North American Title |
Source: Public Records
Mortgage History
| Date | Status | Borrower | Loan Amount |
|---|---|---|---|
| Open | Schenkman Jennifer | $345,186 | |
| Previous Owner | Holt Kim | $218,450 | |
| Closed | Holt Kim | $54,600 |
Source: Public Records
Tax History Compared to Growth
Tax History
| Year | Tax Paid | Tax Assessment Tax Assessment Total Assessment is a certain percentage of the fair market value that is determined by local assessors to be the total taxable value of land and additions on the property. | Land | Improvement |
|---|---|---|---|---|
| 2025 | $2,160 | $35,980 | -- | -- |
| 2024 | $2,124 | $37,390 | $6,030 | $31,360 |
| 2023 | $2,124 | $37,390 | $6,030 | $31,360 |
| 2022 | $1,862 | $26,390 | $4,880 | $21,510 |
| 2021 | $1,940 | $27,150 | $5,020 | $22,130 |
| 2020 | $1,871 | $24,300 | $4,180 | $20,120 |
| 2019 | $1,851 | $24,300 | $4,180 | $20,120 |
| 2018 | $1,639 | $21,150 | $3,240 | $17,910 |
| 2017 | $1,633 | $21,150 | $3,240 | $17,910 |
| 2016 | $1,618 | $20,930 | $3,300 | $17,630 |
| 2015 | $1,615 | $20,930 | $3,300 | $17,630 |
| 2014 | $1,539 | $19,930 | $3,300 | $16,630 |
Source: Public Records
Map
Nearby Homes
- 7705 Chancellor Dr
- 7590 Chancellor Dr
- 7691 Scarborough Dr
- 4455 Archwood Dr
- Fairview Plan at Trailside at Cottonwood Creek
- Deerfield Plan at Trailside at Cottonwood Creek
- Ethridge Plan at Trailside at Cottonwood Creek
- Bryanwood Plan at Trailside at Cottonwood Creek
- Cherry Oak Plan at Trailside at Cottonwood Creek
- Alpine Plan at Trailside at Cottonwood Creek
- 4684 Peak Crest View
- 7775 Manston Dr
- 7985 Interlaken Dr
- 4315 Basswood Dr
- 4574 Peak Crest View
- 4595 Peak Crest View
- 4564 Peak Crest View
- 4585 Peak Crest View
- 8030 Chancellor Dr
- 4575 Peak Crest View
- 4765 Pascal Ct
- 7680 Chancellor Dr
- 4755 Pascal Ct
- 7695 Chancellor Dr
- 7715 Chancellor Dr
- 4745 Pascal Ct
- 4774 Pascal Ct
- 7685 Chancellor Dr
- 4764 Pascal Ct
- 7725 Chancellor Dr
- 4754 Pascal Ct
- 7675 Chancellor Dr
- 4735 Pascal Ct
- 4744 Pascal Ct
- 7735 Chancellor Dr
- 7650 Chancellor Dr
- 7690 Fargo Dr
- 7710 Fargo Dr
- 7665 Chancellor Dr
- 7720 Fargo Dr