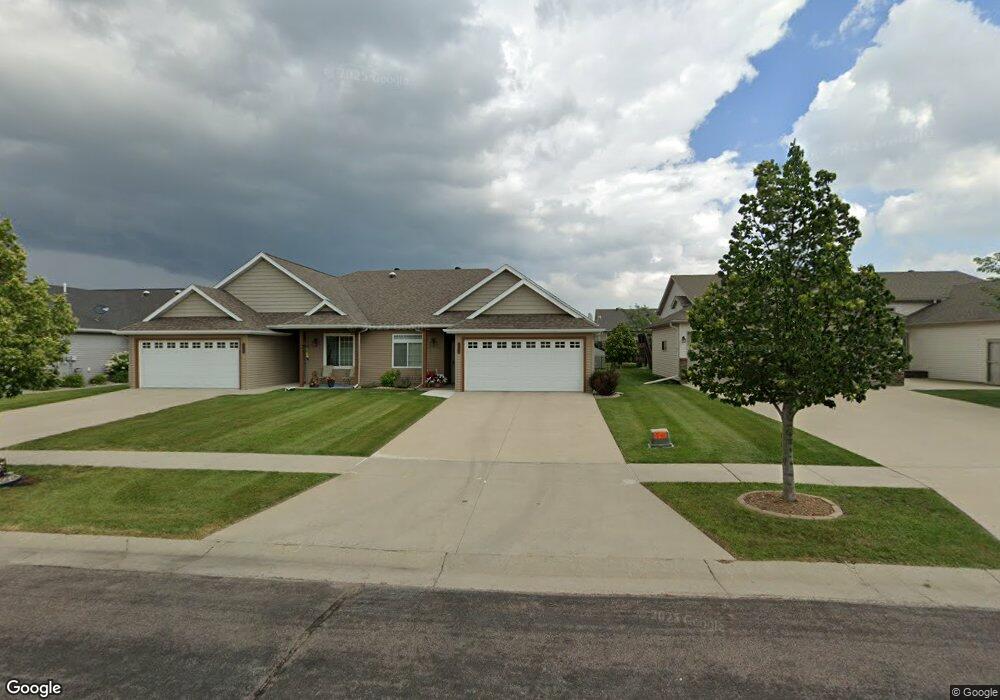
4776 Clock Tower Ln S Fargo, ND 58104
Osgood NeighborhoodEstimated Value: $330,000 - $406,000
3
Beds
2
Baths
1,573
Sq Ft
$237/Sq Ft
Est. Value
About This Home
This home is located at 4776 Clock Tower Ln S, Fargo, ND 58104 and is currently estimated at $372,059, approximately $236 per square foot. 4776 Clock Tower Ln S is a home located in Cass County with nearby schools including Osgood Elementary School, Liberty Middle School, and West Fargo Sheyenne High School.
Ownership History
Date
Name
Owned For
Owner Type
Purchase Details
Closed on
Dec 29, 2011
Sold by
Hout Jeremy
Bought by
Resvick Diane K
Current Estimated Value
Home Financials for this Owner
Home Financials are based on the most recent Mortgage that was taken out on this home.
Original Mortgage
$82,000
Outstanding Balance
$56,244
Interest Rate
3.99%
Mortgage Type
New Conventional
Estimated Equity
$315,815
Purchase Details
Closed on
Sep 4, 2008
Sold by
H & H Properties Of Park Rapids Inc
Bought by
Huot Jeremy
Home Financials for this Owner
Home Financials are based on the most recent Mortgage that was taken out on this home.
Original Mortgage
$143,920
Interest Rate
6.54%
Mortgage Type
New Conventional
Create a Home Valuation Report for This Property
The Home Valuation Report is an in-depth analysis detailing your home's value as well as a comparison with similar homes in the area
Home Values in the Area
Average Home Value in this Area
Purchase History
| Date | Buyer | Sale Price | Title Company |
|---|---|---|---|
| Resvick Diane K | $164,000 | None Available | |
| Huot Jeremy | -- | -- |
Source: Public Records
Mortgage History
| Date | Status | Borrower | Loan Amount |
|---|---|---|---|
| Open | Resvick Diane K | $82,000 | |
| Previous Owner | Huot Jeremy | $143,920 |
Source: Public Records
Tax History Compared to Growth
Tax History
| Year | Tax Paid | Tax Assessment Tax Assessment Total Assessment is a certain percentage of the fair market value that is determined by local assessors to be the total taxable value of land and additions on the property. | Land | Improvement |
|---|---|---|---|---|
| 2024 | $3,779 | $172,750 | $20,600 | $152,150 |
| 2023 | $3,248 | $132,400 | $19,100 | $113,300 |
| 2022 | $3,390 | $132,400 | $19,100 | $113,300 |
| 2021 | $3,423 | $132,400 | $19,100 | $113,300 |
| 2020 | $3,358 | $132,400 | $19,100 | $113,300 |
| 2019 | $3,409 | $132,400 | $10,600 | $121,800 |
| 2018 | $3,310 | $132,400 | $10,600 | $121,800 |
| 2017 | $2,945 | $120,450 | $10,600 | $109,850 |
| 2016 | $2,517 | $109,500 | $10,600 | $98,900 |
| 2015 | $2,441 | $99,550 | $7,950 | $91,600 |
| 2014 | $2,469 | $96,900 | $7,950 | $88,950 |
| 2013 | $2,348 | $92,300 | $7,950 | $84,350 |
Source: Public Records
Map
Nearby Homes
- 4723 Clock Tower Ln S
- 4775 Townsite Place S
- 4450 48th St S
- 4758 Townsite Place S
- 4281 Estate Dr S
- 4272 51st St S
- 4110 52nd St S
- 4127 52nd St S
- 4394 46th Ave S Unit B
- 4245 Coventry Dr S
- 3712 49th St S
- 4318 39 1 2 Ave S
- 5466 Justice Dr S
- 4306 39th Ave S
- 4293 39 1 2 Ave S
- 4824 Decorah Way S
- 4276 39 1 2 Ave S
- 3630 Decorah Way S
- 1665 3-Stall Plan at The Residence at Valley View Estates
- 4274 39 1 2 Ave S
- 4774 Clock Tower Ln S
- 4786 Clock Tower Ln S
- 4788 Clock Tower Ln S
- 4766 Clock Tower Ln S
- 4375 47th St S
- 4391 47th St S
- 4760 Clock Tower Ln S
- 4365 47th St S
- 4789 Clock Tower Ln S
- 4359 47th St S
- 4758 Clock Tower Ln S
- 4781 Clock Tower Ln S
- 4797 Clock Tower Ln S
- 4779 Clock Tower Ln S
- 4377 47th St S
- 4343 47th St S
- 4787 Clock Tower Ln S
- 4773 Clock Tower Ln S
- 4393 47th St S
- 4361 47th St S