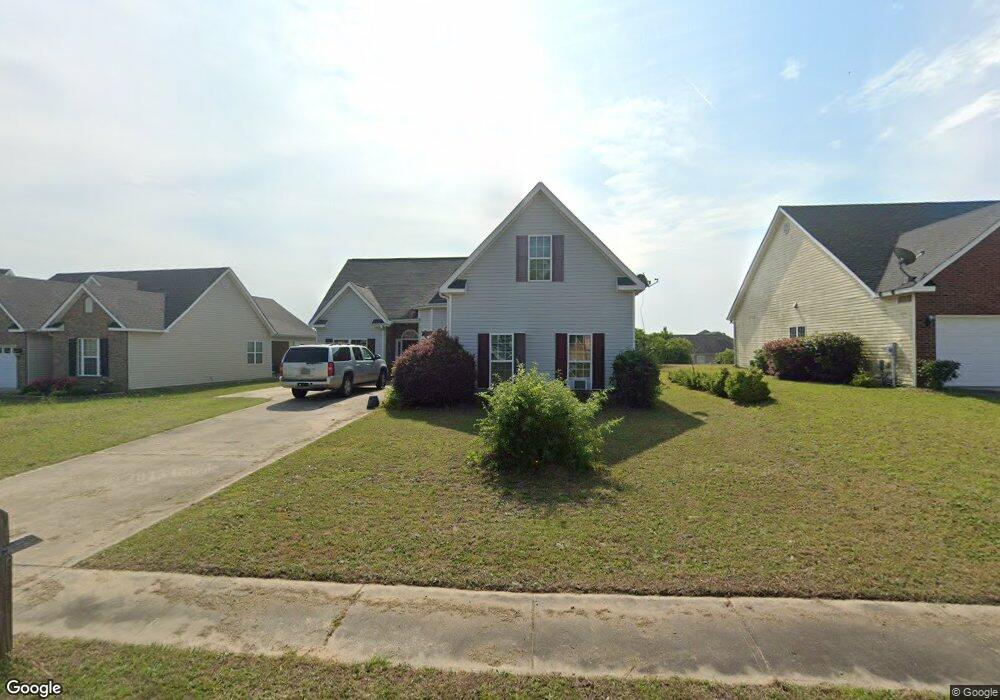
478 Apple Blossom Way Macon, GA 31217
Estimated Value: $195,000 - $211,000
3
Beds
3
Baths
1,887
Sq Ft
$109/Sq Ft
Est. Value
About This Home
This home is located at 478 Apple Blossom Way, Macon, GA 31217 and is currently estimated at $205,526, approximately $108 per square foot. 478 Apple Blossom Way is a home located in Bibb County with nearby schools including Bernd Elementary School, Appling Middle School, and Northeast High School.
Ownership History
Date
Name
Owned For
Owner Type
Purchase Details
Closed on
Oct 29, 2019
Sold by
Haynes Dwayne S
Bought by
Haynes Hariot
Current Estimated Value
Purchase Details
Closed on
Jul 7, 2005
Sold by
J D Construction Llc
Bought by
Haynes Dwayne S
Home Financials for this Owner
Home Financials are based on the most recent Mortgage that was taken out on this home.
Original Mortgage
$141,900
Outstanding Balance
$72,173
Interest Rate
5.46%
Mortgage Type
New Conventional
Estimated Equity
$133,353
Purchase Details
Closed on
Mar 16, 2005
Sold by
Wheelers Landing Llc
Bought by
J D Construction Llc
Home Financials for this Owner
Home Financials are based on the most recent Mortgage that was taken out on this home.
Original Mortgage
$113,520
Interest Rate
5.57%
Mortgage Type
Purchase Money Mortgage
Purchase Details
Closed on
Jul 1, 2004
Create a Home Valuation Report for This Property
The Home Valuation Report is an in-depth analysis detailing your home's value as well as a comparison with similar homes in the area
Home Values in the Area
Average Home Value in this Area
Purchase History
| Date | Buyer | Sale Price | Title Company |
|---|---|---|---|
| Haynes Hariot | -- | None Available | |
| Haynes Dwayne S | $141,900 | None Available | |
| J D Construction Llc | $20,000 | None Available | |
| -- | -- | -- |
Source: Public Records
Mortgage History
| Date | Status | Borrower | Loan Amount |
|---|---|---|---|
| Open | Haynes Dwayne S | $141,900 | |
| Previous Owner | J D Construction Llc | $113,520 |
Source: Public Records
Tax History Compared to Growth
Tax History
| Year | Tax Paid | Tax Assessment Tax Assessment Total Assessment is a certain percentage of the fair market value that is determined by local assessors to be the total taxable value of land and additions on the property. | Land | Improvement |
|---|---|---|---|---|
| 2025 | $1,707 | $76,474 | $6,000 | $70,474 |
| 2024 | $1,496 | $65,922 | $6,000 | $59,922 |
| 2023 | $1,039 | $65,922 | $6,000 | $59,922 |
| 2022 | $2,001 | $64,790 | $7,820 | $56,970 |
| 2021 | $1,751 | $53,078 | $5,984 | $47,094 |
| 2020 | $1,910 | $56,206 | $5,440 | $50,766 |
| 2019 | $1,680 | $49,915 | $5,100 | $44,815 |
| 2018 | $2,218 | $40,989 | $5,100 | $35,889 |
| 2017 | $1,196 | $38,913 | $6,000 | $32,913 |
| 2016 | $1,104 | $38,913 | $6,000 | $32,913 |
| 2015 | $1,529 | $38,216 | $6,000 | $32,216 |
| 2014 | $1,532 | $38,216 | $6,000 | $32,216 |
Source: Public Records
Map
Nearby Homes
- 631 Crabapple Place
- 253 Apple Valley Rd
- 5151 Riggins Mill Rd
- 2766 Stanley Dr
- 2776 Stanley Dr
- 2975 Frederick Dr
- 3741 Franklinton Rd
- 4462 Riggins Mill Rd
- 3917 Jeffersonville Rd
- 3909 Jeffersonville Rd
- 4255 Training School Rd
- 4240 Training School Rd
- 4231 Donnan Rd
- 5055 Riggins Mill Rd
- 3335 Esther Dr
- 3320 Jones Dr
- 4401 Crystal Lake Dr
- 5503 Jeffersonville Rd
- 476 Apple Blossom Way
- 480 Apple Blossom Way
- 472 Apple Blossom Way
- 655 Crabapple Place
- 657 Crabapple Place
- 482 Apple Blossom Way
- 653 Crabapple Place
- 477 Apple Blossom Way
- 661 Crabapple Place
- 479 Apple Blossom Way
- 651 Crabapple Place
- 481 Apple Blossom Way
- 483 Apple Blossom Way
- 484 Apple Blossom Way
- 475 Apple Blossom Way
- 464 Apple Blossom Way
- 464 Apple Blossom Way Unit 126
- 665 Crabapple Place
- 485 Apple Blossom Way
- 654 Crabapple Place