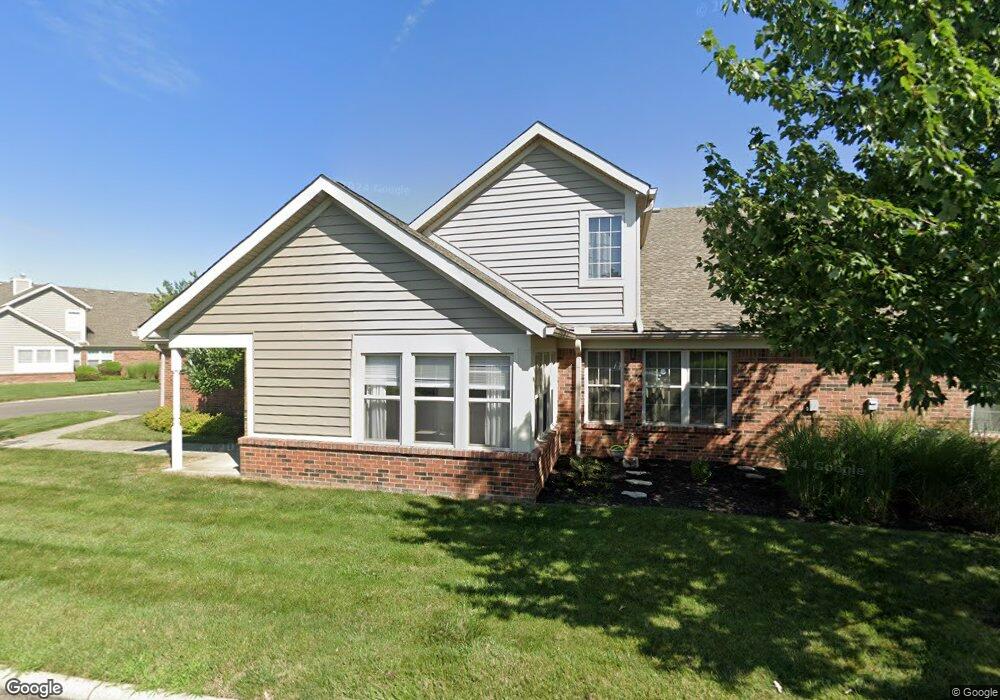
478 Charles Spring Dr Unit 478 Powell, OH 43065
Liberty Township NeighborhoodEstimated Value: $356,486 - $363,000
3
Beds
2
Baths
1,682
Sq Ft
$214/Sq Ft
Est. Value
About This Home
This home is located at 478 Charles Spring Dr Unit 478, Powell, OH 43065 and is currently estimated at $360,122, approximately $214 per square foot. 478 Charles Spring Dr Unit 478 is a home located in Delaware County with nearby schools including Tyler Run Elementary School, Olentangy Liberty Middle School, and Olentangy Liberty High School.
Ownership History
Date
Name
Owned For
Owner Type
Purchase Details
Closed on
Jun 29, 2010
Sold by
Barringer Robert M
Bought by
Barringer Jill F
Current Estimated Value
Purchase Details
Closed on
Jul 27, 2005
Sold by
Baker Sally
Bought by
Barringer Robert M and Barringer Jill F
Home Financials for this Owner
Home Financials are based on the most recent Mortgage that was taken out on this home.
Original Mortgage
$148,000
Outstanding Balance
$78,146
Interest Rate
5.74%
Mortgage Type
Fannie Mae Freddie Mac
Estimated Equity
$281,976
Purchase Details
Closed on
Dec 20, 2002
Sold by
Village Communities Corp
Bought by
Baker Sally
Home Financials for this Owner
Home Financials are based on the most recent Mortgage that was taken out on this home.
Original Mortgage
$100,000
Interest Rate
6.23%
Mortgage Type
New Conventional
Create a Home Valuation Report for This Property
The Home Valuation Report is an in-depth analysis detailing your home's value as well as a comparison with similar homes in the area
Home Values in the Area
Average Home Value in this Area
Purchase History
| Date | Buyer | Sale Price | Title Company |
|---|---|---|---|
| Barringer Jill F | -- | Title First | |
| Barringer Robert M | $188,500 | Peak Title | |
| Baker Sally | $168,500 | -- |
Source: Public Records
Mortgage History
| Date | Status | Borrower | Loan Amount |
|---|---|---|---|
| Open | Barringer Robert M | $148,000 | |
| Previous Owner | Baker Sally | $100,000 |
Source: Public Records
Tax History Compared to Growth
Tax History
| Year | Tax Paid | Tax Assessment Tax Assessment Total Assessment is a certain percentage of the fair market value that is determined by local assessors to be the total taxable value of land and additions on the property. | Land | Improvement |
|---|---|---|---|---|
| 2024 | $6,192 | $98,840 | $18,550 | $80,290 |
| 2023 | $6,212 | $98,840 | $18,550 | $80,290 |
| 2022 | $5,947 | $77,640 | $15,930 | $61,710 |
| 2021 | $6,035 | $77,640 | $15,930 | $61,710 |
| 2020 | $6,054 | $77,640 | $15,930 | $61,710 |
| 2019 | $4,540 | $60,100 | $12,250 | $47,850 |
| 2018 | $4,586 | $60,100 | $12,250 | $47,850 |
| 2017 | $1,962 | $52,500 | $8,750 | $43,750 |
| 2016 | $4,259 | $52,500 | $8,750 | $43,750 |
| 2015 | $3,924 | $52,500 | $8,750 | $43,750 |
| 2014 | $3,969 | $52,500 | $8,750 | $43,750 |
| 2013 | $4,049 | $52,500 | $8,750 | $43,750 |
Source: Public Records
Map
Nearby Homes
- 409 Charles Spring Dr
- 255 Winter Hill Place
- 87 Murphys Oval Unit N87
- 10053 Juliana Cir Unit 10053
- 9406 Cadogan Ct
- 4162 Pyke Dr
- 3899 Hampshire Ave
- 114 Encore Park Bend
- Oakley Plan at Encore Park of Powell - Uptown Collection
- Irving Plan at Encore Park of Powell - Uptown Collection
- 110 Encore Park Bend
- 6615 Scioto St
- 6555 Scioto St
- 6583 Scioto St
- 6601 Scioto St
- 9529 Wayne Brown Dr
- 10324 Braemar Dr
- 2105 Liberty St
- 2020 Liberty St
- 1937 Liberty St
- 474 Charles Spring Dr Unit 474
- 462 Charlescarn Dr
- 479 Charles Spring Dr Unit 479
- 471 Charles Spring Dr Unit 471
- 470 Charles Spring Dr Unit 470
- 486 Charles Spring Dr Unit 486
- 482 Charles Spring Dr Unit 482
- 469 Charlescarn Dr Unit 469
- 458 Charlescarn Dr
- 460 Charlescarn Dr
- 466 Charles Spring Dr Unit 466
- 475 Charles Spring Dr Unit 475
- 491 Charles Spring Dr Unit 491
- 441 Charles Spring Dr Unit 441
- 495 Charles Spring Dr
- 454 Charlescarn Dr
- 445 Charles Spring Dr Unit 445
- 456 Charlescarn Dr Unit 456
- 483 Charles Spring Dr Unit 483