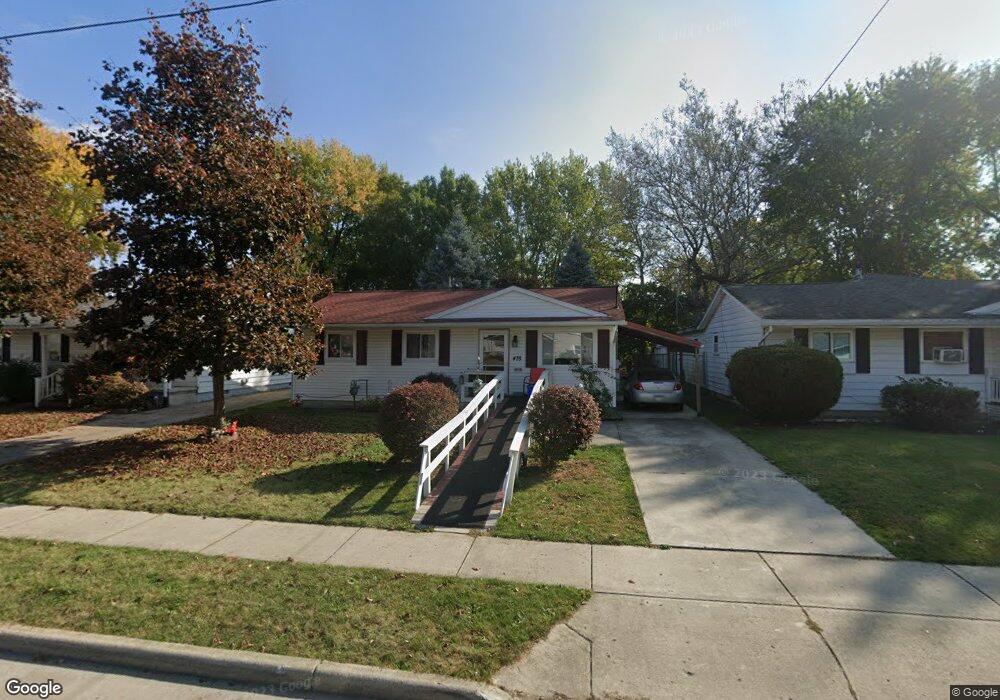
478 Clinton St Marion, OH 43302
Estimated Value: $100,414 - $131,000
3
Beds
1
Bath
875
Sq Ft
$128/Sq Ft
Est. Value
About This Home
This home is located at 478 Clinton St, Marion, OH 43302 and is currently estimated at $112,354, approximately $128 per square foot. 478 Clinton St is a home located in Marion County with nearby schools including James A. Garfield Elementary School, Ulysses S. Grant Middle School, and Harding High School.
Ownership History
Date
Name
Owned For
Owner Type
Purchase Details
Closed on
Aug 1, 2025
Sold by
Wagner William Patrick and Wagner Denise
Bought by
Miller Eileen M and Williams Eileen M
Current Estimated Value
Purchase Details
Closed on
Jul 1, 2025
Sold by
Whiteis Jennifer L and Whiteis Peter
Bought by
Miller Eileen M and Williams Eileen M
Purchase Details
Closed on
Jun 30, 2025
Sold by
Wagner Michele D
Bought by
Miller Eileen M and Williams Eileen M
Purchase Details
Closed on
Apr 29, 2021
Sold by
Williams and Carol
Bought by
Williams Eileen M
Create a Home Valuation Report for This Property
The Home Valuation Report is an in-depth analysis detailing your home's value as well as a comparison with similar homes in the area
Home Values in the Area
Average Home Value in this Area
Purchase History
| Date | Buyer | Sale Price | Title Company |
|---|---|---|---|
| Miller Eileen M | -- | None Listed On Document | |
| Miller Eileen M | -- | None Listed On Document | |
| Miller Eileen M | -- | None Listed On Document | |
| Williams Eileen M | -- | Osborne Wesley W |
Source: Public Records
Tax History
| Year | Tax Paid | Tax Assessment Tax Assessment Total Assessment is a certain percentage of the fair market value that is determined by local assessors to be the total taxable value of land and additions on the property. | Land | Improvement |
|---|---|---|---|---|
| 2025 | $462 | $26,010 | $2,280 | $23,730 |
| 2024 | $462 | $22,080 | $2,250 | $19,830 |
| 2023 | $462 | $22,080 | $2,250 | $19,830 |
| 2022 | $464 | $22,080 | $2,250 | $19,830 |
| 2021 | $328 | $17,210 | $1,960 | $15,250 |
| 2020 | $328 | $17,210 | $1,960 | $15,250 |
| 2019 | $328 | $17,210 | $1,960 | $15,250 |
| 2018 | $213 | $14,240 | $1,960 | $12,280 |
| 2017 | $216 | $14,240 | $1,960 | $12,280 |
| 2016 | $213 | $14,240 | $1,960 | $12,280 |
| 2015 | $195 | $13,670 | $1,750 | $11,920 |
| 2014 | $197 | $13,670 | $1,750 | $11,920 |
| 2012 | $200 | $13,740 | $1,770 | $11,970 |
Source: Public Records
Map
Nearby Homes
Your Personal Tour Guide
Ask me questions while you tour the home.