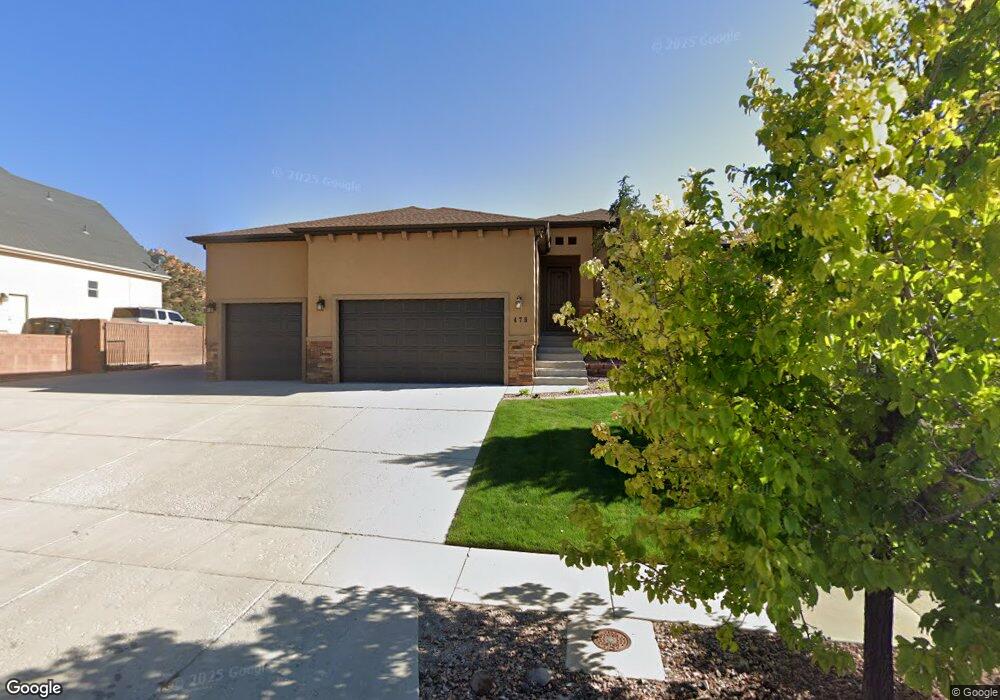
478 E Canyon View Dr Cedar City, UT 84721
Estimated Value: $679,058 - $928,000
5
Beds
5
Baths
3,600
Sq Ft
$209/Sq Ft
Est. Value
About This Home
This home is located at 478 E Canyon View Dr, Cedar City, UT 84721 and is currently estimated at $754,015, approximately $209 per square foot. 478 E Canyon View Dr is a home located in Iron County with nearby schools including Fiddlers Canyon School, Canyon View Middle School, and Canyon View High School.
Ownership History
Date
Name
Owned For
Owner Type
Purchase Details
Closed on
Dec 15, 2021
Sold by
Santillo Lorna L
Bought by
Jessop Sidney Nathan and Jessop Susan
Current Estimated Value
Home Financials for this Owner
Home Financials are based on the most recent Mortgage that was taken out on this home.
Original Mortgage
$601,350
Outstanding Balance
$552,936
Interest Rate
3.09%
Mortgage Type
New Conventional
Estimated Equity
$201,079
Purchase Details
Closed on
Dec 13, 2012
Sold by
Clark Craig A and Clark Linda L
Bought by
Cheney Financial Services Inc
Purchase Details
Closed on
Sep 25, 2006
Sold by
Clark Craig A and Clark Linda L
Bought by
Clark Craig A and Clark Linda L
Purchase Details
Closed on
Feb 23, 2006
Sold by
Ns Canyon Ridge Llc
Bought by
D K Jensen Construction Inc
Create a Home Valuation Report for This Property
The Home Valuation Report is an in-depth analysis detailing your home's value as well as a comparison with similar homes in the area
Home Values in the Area
Average Home Value in this Area
Purchase History
| Date | Buyer | Sale Price | Title Company |
|---|---|---|---|
| Jessop Sidney Nathan | $799,795 | Eagle Gate Title Insurance Agc | |
| Cheney Financial Services Inc | -- | Lincoln Title Ins Agency | |
| Clark Craig A | -- | -- | |
| D K Jensen Construction Inc | -- | -- |
Source: Public Records
Mortgage History
| Date | Status | Borrower | Loan Amount |
|---|---|---|---|
| Open | Jessop Sidney Nathan | $601,350 |
Source: Public Records
Tax History
| Year | Tax Paid | Tax Assessment Tax Assessment Total Assessment is a certain percentage of the fair market value that is determined by local assessors to be the total taxable value of land and additions on the property. | Land | Improvement |
|---|---|---|---|---|
| 2025 | $3,201 | $411,564 | $59,459 | $352,105 |
| 2023 | $3,273 | $415,295 | $67,570 | $347,725 |
| 2022 | $2,937 | $319,455 | $51,975 | $267,480 |
| 2021 | $2,593 | $282,110 | $38,500 | $243,610 |
| 2020 | $2,698 | $260,270 | $38,500 | $221,770 |
| 2019 | $2,632 | $242,820 | $38,500 | $204,320 |
| 2018 | $2,615 | $233,410 | $38,500 | $194,910 |
| 2017 | $2,600 | $228,435 | $38,500 | $189,935 |
| 2016 | $2,435 | $199,260 | $26,400 | $172,860 |
| 2015 | $2,642 | $204,975 | $0 | $0 |
| 2014 | $2,595 | $188,340 | $0 | $0 |
Source: Public Records
Map
Nearby Homes
- 1205 N Fairview Dr Unit 58
- 1205 N Fairview Dr
- 1472 N Knoll St
- 486 E Hillview Dr
- 1283 N Knoll St
- 1406 S N Fairway Dr
- 1471 N Knoll St Unit 44
- 1471 N Knoll St
- 1380 N Knoll St
- 1490 N Knoll St
- 1509 N Knoll St
- 811 Canyon Ridge Dr
- 668 E Fiddlers Cove Dr Unit 39
- 397 E 900 N Unit 3D
- 397 E 900 N Unit 3C
- 397 E 900 N Unit 4B
- 397 E 900 N Unit 3D
- 397 E 900 N Unit 3F
- 397 E 900 N Unit 3E
- 397 E 900 N Unit 4B
- 478 E 1250 N Unit 12
- 478 E 1250 N
- 496 E Canyon View Dr
- 496 E 1250 N
- 460 E Canyon View Dr
- 461 E Canyon View Dr
- 512 E 1250 N
- 1221 N Fairview Dr
- 871 E Canyon View Dr
- 1231 Fairview Dr
- 1276 N Parkside Dr
- 528 E 1250 N
- 1281 N Ridgeway Dr
- 1254 N Ridgeway Dr
- 1288 N Parkside Dr
- 412 E Canyon View Dr
- 412 E 1250 N Unit Canyon Ridge PUD
- 1270 N Ridgeway Dr
- 1273 N Parkside Dr Unit (Parkside Dr)
- 1273 N Parkside Dr
Your Personal Tour Guide
Ask me questions while you tour the home.