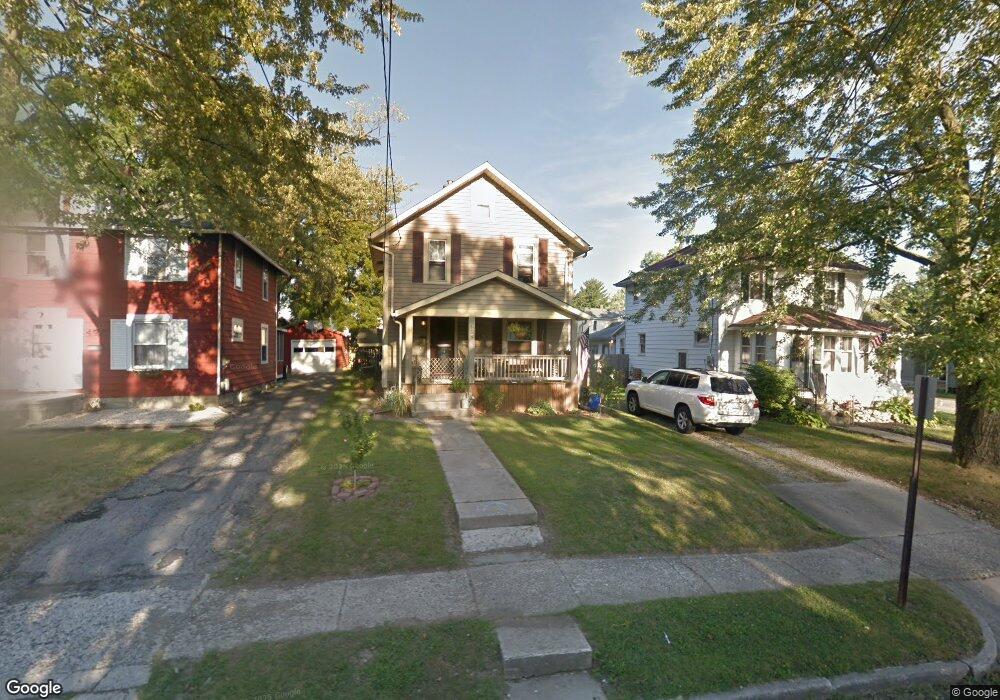
478 Forest St Marion, OH 43302
Estimated Value: $149,545 - $197,000
3
Beds
1
Bath
1,264
Sq Ft
$130/Sq Ft
Est. Value
About This Home
This home is located at 478 Forest St, Marion, OH 43302 and is currently estimated at $164,886, approximately $130 per square foot. 478 Forest St is a home located in Marion County with nearby schools including Benjamin Harrison Elementary School, Ulysses S. Grant Middle School, and Harding High School.
Ownership History
Date
Name
Owned For
Owner Type
Purchase Details
Closed on
Mar 2, 2021
Sold by
Robinson Ezekiel and Robinson Angela Marie
Bought by
Robinson Ezekiel
Current Estimated Value
Home Financials for this Owner
Home Financials are based on the most recent Mortgage that was taken out on this home.
Original Mortgage
$77,527
Outstanding Balance
$69,216
Interest Rate
3.11%
Mortgage Type
New Conventional
Estimated Equity
$95,670
Purchase Details
Closed on
Jun 28, 2010
Sold by
Winn Kami K and Bailey Todd A
Bought by
Robinson Ezekiel W and Robinson Ashley A
Home Financials for this Owner
Home Financials are based on the most recent Mortgage that was taken out on this home.
Original Mortgage
$68,970
Interest Rate
5.5%
Mortgage Type
FHA
Purchase Details
Closed on
Aug 12, 2009
Sold by
Winn Christopher M
Bought by
Winn Kami K
Purchase Details
Closed on
Jun 29, 1993
Bought by
Robinson Ezekiel W and Surv Ashley A
Create a Home Valuation Report for This Property
The Home Valuation Report is an in-depth analysis detailing your home's value as well as a comparison with similar homes in the area
Home Values in the Area
Average Home Value in this Area
Purchase History
| Date | Buyer | Sale Price | Title Company |
|---|---|---|---|
| Robinson Ezekiel | -- | None Available | |
| Robinson Ezekiel | -- | Amrock | |
| Robinson Ezekiel W | $69,900 | Eagle Title Llc | |
| Winn Kami K | -- | None Available | |
| Robinson Ezekiel W | $57,500 | -- |
Source: Public Records
Mortgage History
| Date | Status | Borrower | Loan Amount |
|---|---|---|---|
| Open | Robinson Ezekiel | $77,527 | |
| Closed | Robinson Ezekiel | $77,527 | |
| Closed | Robinson Ezekiel W | $68,970 |
Source: Public Records
Tax History
| Year | Tax Paid | Tax Assessment Tax Assessment Total Assessment is a certain percentage of the fair market value that is determined by local assessors to be the total taxable value of land and additions on the property. | Land | Improvement |
|---|---|---|---|---|
| 2025 | $2,056 | $46,930 | $6,170 | $40,760 |
| 2024 | $2,056 | $36,450 | $5,880 | $30,570 |
| 2023 | $2,056 | $36,450 | $5,880 | $30,570 |
| 2022 | $1,908 | $36,450 | $5,880 | $30,570 |
| 2021 | $1,520 | $28,620 | $5,110 | $23,510 |
| 2020 | $1,322 | $28,620 | $5,110 | $23,510 |
| 2019 | $1,104 | $28,620 | $5,110 | $23,510 |
| 2018 | $1,077 | $27,940 | $5,120 | $22,820 |
| 2017 | $1,091 | $27,940 | $5,120 | $22,820 |
| 2016 | $1,085 | $27,940 | $5,120 | $22,820 |
| 2015 | $1,082 | $27,260 | $4,870 | $22,390 |
| 2014 | $1,083 | $27,260 | $4,870 | $22,390 |
| 2012 | $1,179 | $29,470 | $3,730 | $25,740 |
Source: Public Records
Map
Nearby Homes
- 557 Summit St
- 482 King Ave
- 556 Hane Ave
- 553 King Ave
- 310 Hane Ave
- 667 King Ave
- 645 Indiana Ave
- 654 Vernon Heights Blvd
- 210 Hane Ave
- 569 E Church St
- 211 Saint James St
- 551 Courtland Ave
- 222 Uhler Ave
- 400 Forest Lawn Blvd
- 136 Baker St Unit 4
- 223 Forest Lawn Blvd
- 125 Uhler Ave
- 372 S Main St
- 531 S Main St
- 126 W Washington Ave
Your Personal Tour Guide
Ask me questions while you tour the home.