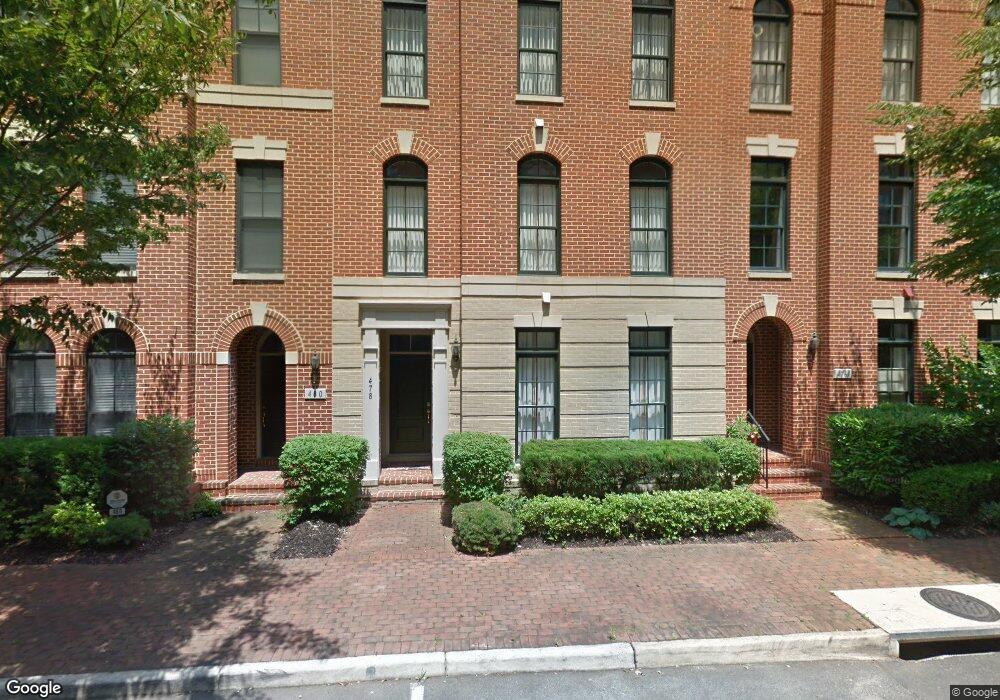
478 Harbor Side St Woodbridge, VA 22191
Belmont Bay NeighborhoodEstimated Value: $680,000 - $770,000
2
Beds
3
Baths
2,144
Sq Ft
$339/Sq Ft
Est. Value
About This Home
This home is located at 478 Harbor Side St, Woodbridge, VA 22191 and is currently estimated at $727,695, approximately $339 per square foot. 478 Harbor Side St is a home located in Prince William County with nearby schools including Belmont Elementary School, Fred M. Lynn Middle School, and Freedom High School.
Ownership History
Date
Name
Owned For
Owner Type
Purchase Details
Closed on
Feb 21, 2006
Sold by
Miller&Smith At Belmont B
Bought by
Flynn Paul
Current Estimated Value
Home Financials for this Owner
Home Financials are based on the most recent Mortgage that was taken out on this home.
Original Mortgage
$562,688
Outstanding Balance
$316,208
Interest Rate
6.17%
Mortgage Type
New Conventional
Estimated Equity
$411,487
Create a Home Valuation Report for This Property
The Home Valuation Report is an in-depth analysis detailing your home's value as well as a comparison with similar homes in the area
Home Values in the Area
Average Home Value in this Area
Purchase History
| Date | Buyer | Sale Price | Title Company |
|---|---|---|---|
| Flynn Paul | $703,360 | -- |
Source: Public Records
Mortgage History
| Date | Status | Borrower | Loan Amount |
|---|---|---|---|
| Open | Flynn Paul | $562,688 |
Source: Public Records
Tax History Compared to Growth
Tax History
| Year | Tax Paid | Tax Assessment Tax Assessment Total Assessment is a certain percentage of the fair market value that is determined by local assessors to be the total taxable value of land and additions on the property. | Land | Improvement |
|---|---|---|---|---|
| 2025 | $6,570 | $693,900 | $212,400 | $481,500 |
| 2024 | $6,570 | $660,600 | $202,300 | $458,300 |
| 2023 | $6,523 | $626,900 | $190,800 | $436,100 |
| 2022 | $6,927 | $616,800 | $187,100 | $429,700 |
| 2021 | $6,801 | $560,200 | $170,100 | $390,100 |
| 2020 | $8,272 | $533,700 | $162,000 | $371,700 |
| 2019 | $8,237 | $531,400 | $162,000 | $369,400 |
| 2018 | $6,348 | $525,700 | $160,300 | $365,400 |
| 2017 | $6,279 | $512,700 | $155,700 | $357,000 |
| 2016 | $5,941 | $489,400 | $148,200 | $341,200 |
| 2015 | $5,456 | $481,000 | $145,300 | $335,700 |
| 2014 | $5,456 | $439,300 | $132,100 | $307,200 |
Source: Public Records
Map
Nearby Homes
- 485 Harbor Side St Unit 412
- 485 Harbor Side St Unit 407
- 485 Harbor Side St Unit 714
- 485 Harbor Side St Unit 405
- Marbella Plan at Beacon Park - Townhomes
- The Galleon Plan at Beacon Park - Elevator Townhomes for 55+
- 645 Angelfish Way
- 647 Angelfish Way
- 680 Watermans Dr Unit 301
- 680 Watermans Dr Unit 505
- 13717 Course View Way
- 13818 Custis Square
- 743 Vestal St
- 1 Belmont Bay Dr
- 13804 Greendale Dr Unit 68
- 810 Belmont Bay Dr Unit 303
- 13711 Joyce Rd
- 13368 Ferry Landing Ln
- 13721 Richmond Hwy Unit TRLR 92
- 10623 Old Colchester Rd
- 480 Harbor Side St
- 476 Harbor Unit Street
- 474 Harbor Side St
- 13759 Tides St
- 13761 Tides St
- 13757 Tides St
- 472 Harbor Side St
- 449 Belmont Bay Dr
- 13753 Tides St
- 447 Belmont Bay Dr
- 470 Harbor Side St
- 445 Belmont Bay Dr
- 13751 Tides St
- 443 Belmont Bay Dr
- 441 Belmont Bay Dr
- 13758 Tides St
- 13760 Tides St
- 13756 Tides St
- 13754 Tides St
- 13752 Tides St