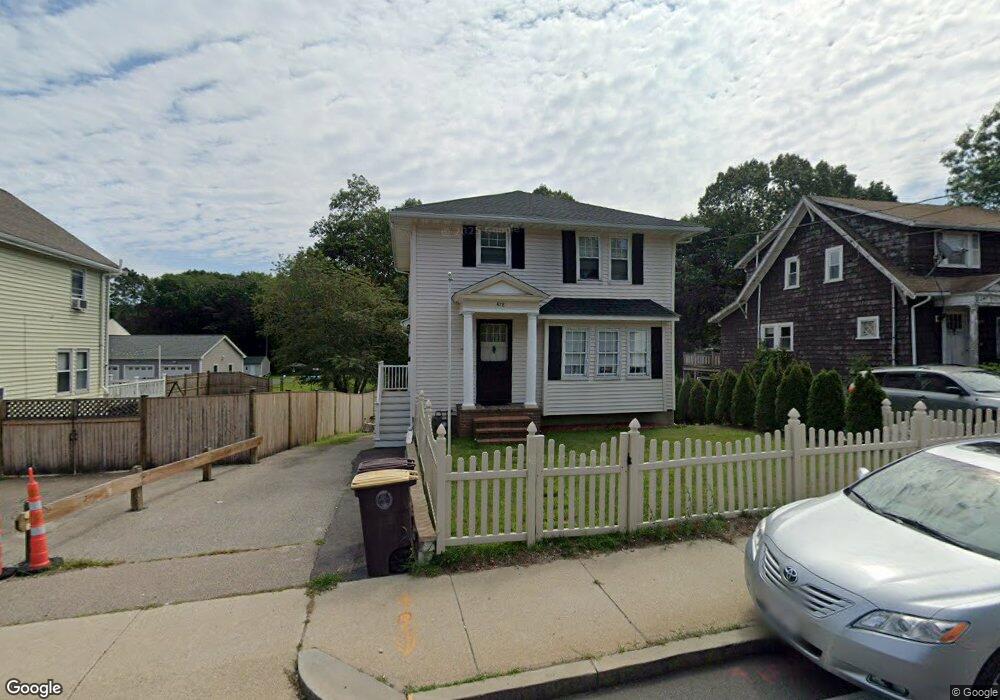
478 Main St South Weymouth, MA 02190
South Weymouth NeighborhoodEstimated Value: $567,359 - $691,000
4
Beds
1
Bath
1,411
Sq Ft
$440/Sq Ft
Est. Value
About This Home
This home is located at 478 Main St, South Weymouth, MA 02190 and is currently estimated at $620,340, approximately $439 per square foot. 478 Main St is a home located in Norfolk County with nearby schools including Thomas V Nash, Abigail Adams Middle School, and Weymouth Middle School Chapman.
Ownership History
Date
Name
Owned For
Owner Type
Purchase Details
Closed on
Jul 21, 1999
Sold by
Gunville Francis W and Gunville Lucille C
Bought by
Mattera Madeline M
Current Estimated Value
Home Financials for this Owner
Home Financials are based on the most recent Mortgage that was taken out on this home.
Original Mortgage
$125,200
Interest Rate
7.49%
Mortgage Type
Purchase Money Mortgage
Create a Home Valuation Report for This Property
The Home Valuation Report is an in-depth analysis detailing your home's value as well as a comparison with similar homes in the area
Home Values in the Area
Average Home Value in this Area
Purchase History
| Date | Buyer | Sale Price | Title Company |
|---|---|---|---|
| Mattera Madeline M | $167,000 | -- |
Source: Public Records
Mortgage History
| Date | Status | Borrower | Loan Amount |
|---|---|---|---|
| Open | Mattera Madeline M | $109,000 | |
| Closed | Mattera Madeline M | $125,200 | |
| Previous Owner | Mattera Madeline M | $20,000 |
Source: Public Records
Tax History Compared to Growth
Tax History
| Year | Tax Paid | Tax Assessment Tax Assessment Total Assessment is a certain percentage of the fair market value that is determined by local assessors to be the total taxable value of land and additions on the property. | Land | Improvement |
|---|---|---|---|---|
| 2025 | $4,451 | $440,700 | $183,600 | $257,100 |
| 2024 | $4,311 | $419,800 | $174,900 | $244,900 |
| 2023 | $4,378 | $418,900 | $182,100 | $236,800 |
| 2022 | $4,273 | $372,900 | $168,600 | $204,300 |
| 2021 | $3,699 | $315,100 | $149,900 | $165,200 |
| 2020 | $3,510 | $294,500 | $149,900 | $144,600 |
| 2019 | $3,425 | $282,600 | $144,200 | $138,400 |
| 2018 | $3,320 | $265,600 | $137,300 | $128,300 |
| 2017 | $3,172 | $247,600 | $130,800 | $116,800 |
| 2016 | $3,073 | $240,100 | $125,800 | $114,300 |
| 2015 | $3,011 | $233,400 | $125,800 | $107,600 |
| 2014 | $2,927 | $220,100 | $117,000 | $103,100 |
Source: Public Records
Map
Nearby Homes
- 2 Tara Dr Unit 1
- 2 Mitchell Ln Unit B
- 200 Justin Dr Unit 3
- 200 Burkhall St Unit 803
- 200 Burkhall St Unit 102
- 116 Belmont St
- 191 Tall Oaks Dr Unit C
- 255 West St
- 747 Middle St
- 262 West St
- 120 Burkhall St Unit K
- 110 Burkhall St Unit H
- 27 Park Ave
- 92 Mercury St
- 215 Winter St Unit 1P
- 25 Echo Ave
- 376 Pleasant St
- 261 Pleasant St Unit 3
- 261 Pleasant St Unit 5
- 501 Commerce Dr Unit 2310