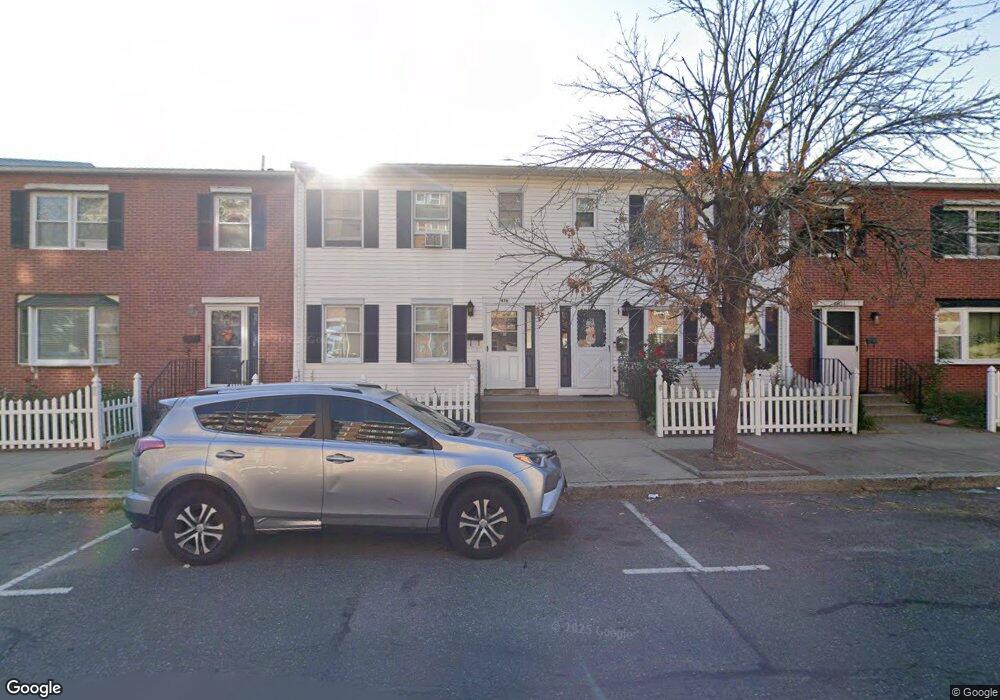
478 Maple St Holyoke, MA 01040
Estimated Value: $154,000 - $221,939
2
Beds
2
Baths
1,120
Sq Ft
$163/Sq Ft
Est. Value
About This Home
This home is located at 478 Maple St, Holyoke, MA 01040 and is currently estimated at $182,735, approximately $163 per square foot. 478 Maple St is a home located in Hampden County with nearby schools including Holyoke High School, Mater Dolorosa Elementary School, and Blessed Sacrament School.
Ownership History
Date
Name
Owned For
Owner Type
Purchase Details
Closed on
Oct 6, 2009
Sold by
Ortiz Felicita
Bought by
Ortiz Felicita and Ortiz Marytza
Current Estimated Value
Purchase Details
Closed on
Oct 28, 2003
Sold by
Pianka Jan and Pianka John
Bought by
Ortiz Felicita
Home Financials for this Owner
Home Financials are based on the most recent Mortgage that was taken out on this home.
Original Mortgage
$49,700
Interest Rate
6.15%
Mortgage Type
Purchase Money Mortgage
Create a Home Valuation Report for This Property
The Home Valuation Report is an in-depth analysis detailing your home's value as well as a comparison with similar homes in the area
Home Values in the Area
Average Home Value in this Area
Purchase History
| Date | Buyer | Sale Price | Title Company |
|---|---|---|---|
| Ortiz Felicita | -- | -- | |
| Ortiz Felicita | $74,000 | -- |
Source: Public Records
Mortgage History
| Date | Status | Borrower | Loan Amount |
|---|---|---|---|
| Previous Owner | Ortiz Felicita | $49,700 | |
| Previous Owner | Ortiz Felicita | $20,000 | |
| Previous Owner | Ortiz Felicita | $4,378 |
Source: Public Records
Tax History Compared to Growth
Tax History
| Year | Tax Paid | Tax Assessment Tax Assessment Total Assessment is a certain percentage of the fair market value that is determined by local assessors to be the total taxable value of land and additions on the property. | Land | Improvement |
|---|---|---|---|---|
| 2025 | $2,542 | $145,600 | $0 | $145,600 |
| 2024 | $2,585 | $136,400 | $0 | $136,400 |
| 2023 | $2,253 | $120,100 | $0 | $120,100 |
| 2022 | $2,313 | $120,100 | $0 | $120,100 |
| 2021 | $2,093 | $108,600 | $0 | $108,600 |
| 2020 | $1,866 | $97,800 | $0 | $97,800 |
| 2019 | $1,840 | $95,400 | $0 | $95,400 |
| 2018 | $1,825 | $95,400 | $0 | $95,400 |
| 2017 | $1,829 | $95,400 | $0 | $95,400 |
| 2016 | $1,771 | $92,600 | $0 | $92,600 |
| 2015 | $1,763 | $92,600 | $0 | $92,600 |
Source: Public Records
Map
Nearby Homes