Estimated Value: $138,000 - $170,000
3
Beds
3
Baths
1,241
Sq Ft
$123/Sq Ft
Est. Value
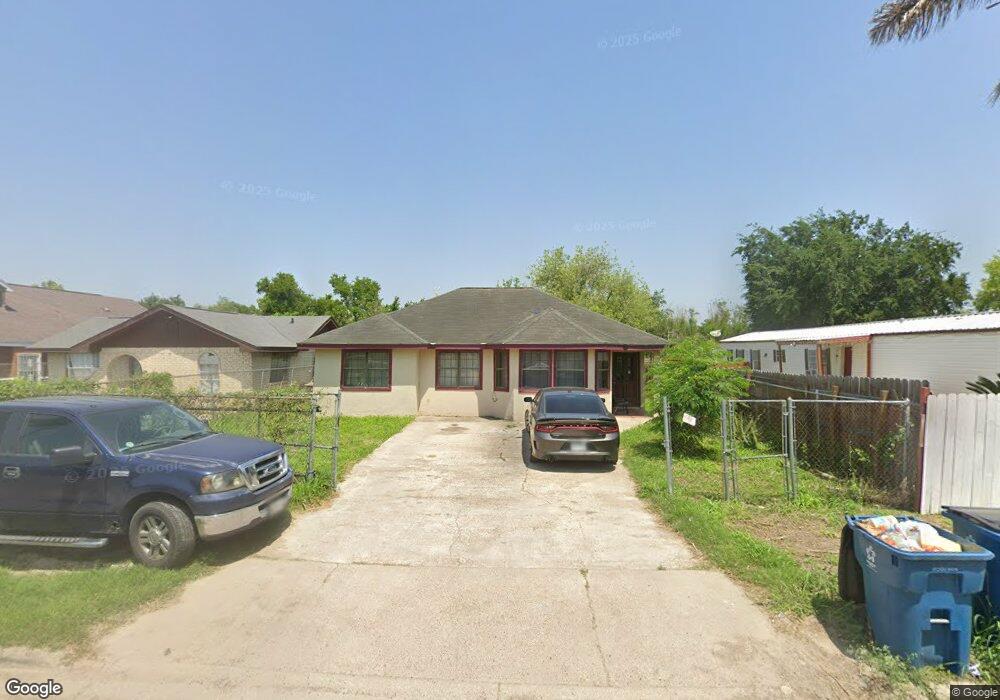
About This Home
This home is located at 478 Monterey Dr, Alamo, TX 78516 and is currently estimated at $152,846, approximately $123 per square foot. 478 Monterey Dr is a home located in Hidalgo County with nearby schools including Capt. D. Salinas Elementary School, A.P. Solis Middle School, and Donna High School.
Ownership History
Date
Name
Owned For
Owner Type
Purchase Details
Closed on
Jun 18, 2014
Sold by
Rb Rgv Ltd
Bought by
Rangel Glovanni and Hernandez Melissa
Current Estimated Value
Home Financials for this Owner
Home Financials are based on the most recent Mortgage that was taken out on this home.
Original Mortgage
$37,400
Outstanding Balance
$28,479
Interest Rate
4.23%
Mortgage Type
Purchase Money Mortgage
Estimated Equity
$124,367
Purchase Details
Closed on
Oct 20, 1997
Sold by
L D Land Co Inc
Bought by
Rangel Armando and Rangel Nora H
Create a Home Valuation Report for This Property
The Home Valuation Report is an in-depth analysis detailing your home's value as well as a comparison with similar homes in the area
Home Values in the Area
Average Home Value in this Area
Purchase History
| Date | Buyer | Sale Price | Title Company |
|---|---|---|---|
| Rangel Glovanni | -- | None Available | |
| Rangel Armando | -- | -- |
Source: Public Records
Mortgage History
| Date | Status | Borrower | Loan Amount |
|---|---|---|---|
| Open | Rangel Glovanni | $37,400 |
Source: Public Records
Tax History Compared to Growth
Tax History
| Year | Tax Paid | Tax Assessment Tax Assessment Total Assessment is a certain percentage of the fair market value that is determined by local assessors to be the total taxable value of land and additions on the property. | Land | Improvement |
|---|---|---|---|---|
| 2025 | $1,304 | $95,742 | -- | -- |
| 2024 | $1,304 | $87,038 | -- | -- |
| 2023 | $2,014 | $79,125 | $0 | $0 |
| 2022 | $1,874 | $71,932 | $0 | $0 |
| 2021 | $1,716 | $65,393 | $23,155 | $42,238 |
| 2020 | $1,686 | $62,198 | $23,155 | $39,043 |
| 2019 | $1,525 | $55,600 | $23,155 | $32,445 |
| 2018 | $1,525 | $55,978 | $23,155 | $34,135 |
| 2017 | $1,404 | $50,889 | $15,859 | $35,262 |
| 2016 | $1,276 | $46,263 | $13,005 | $33,258 |
| 2015 | $1,104 | $47,291 | $13,005 | $34,286 |
Source: Public Records
Map
Nearby Homes
- 1101 S Tower Rd
- 504 Monterrey Dr
- 405 Tudor Ct
- 1001 Las Flores Dr
- 417 Charles Cir
- 1009 Las Flores Dr
- 0 S Tower Rd
- 806 Post Oak Dr
- 502 E Fannin St
- 524 E Fannin Ave
- 408 Rene St
- 534 Hunter Dr
- 482 Cripple Creek Cir
- 908 Bella Ave
- 806 Dulce Dr
- 1047 Nina Ave
- 1044 Nina Ave
- 1038 Lola Ave
- 421 Serg Loop
- 1049 Nina Ave
- 480 Monterey Dr
- 482 Monterey Dr
- 000 Monterrey Dr
- 472 Monterey Dr
- 484 Monterey Dr
- 479 Monterey Dr
- 477 Monterey Dr
- 475 Monterey Dr
- 483 Monterey Dr
- 403 Monterey Dr Unit 47
- 403 Monterey Dr
- 473 Monterey Dr
- 900 S Tower Rd
- 468 Monterey Dr
- 485 Monterey Dr
- 401 Monterrey St
- 487 Monterey Dr
- 405 Monterrey Dr
- 469 Monterey Dr
- 466 Monterey Dr