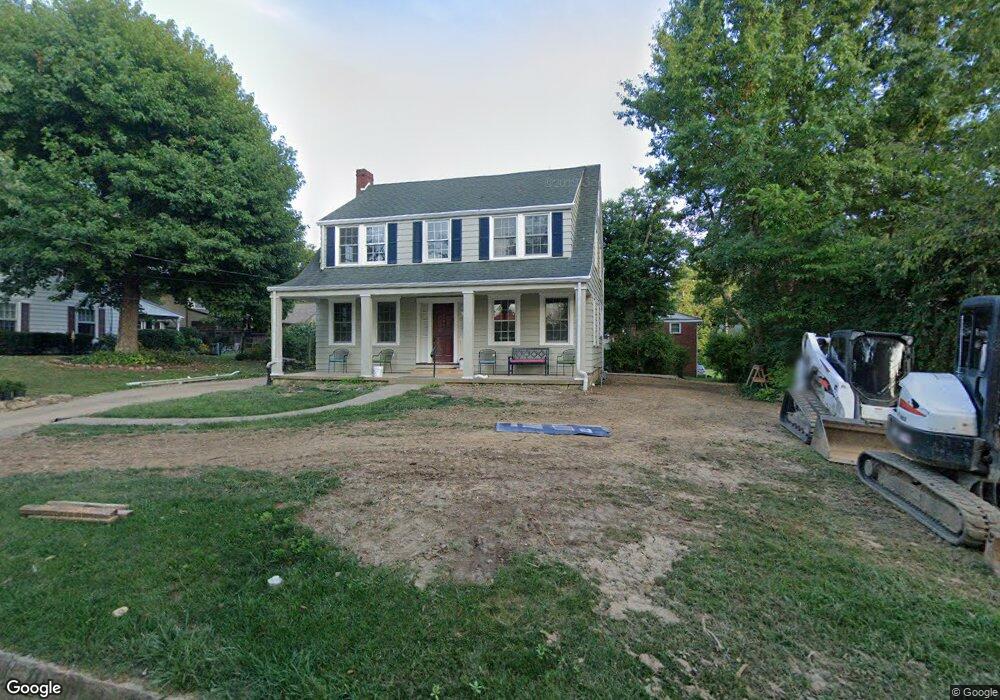
478 Pythian St Morgantown, WV 26505
Suncrest NeighborhoodEstimated Value: $582,000 - $946,000
4
Beds
5
Baths
3,370
Sq Ft
$215/Sq Ft
Est. Value
About This Home
This home is located at 478 Pythian St, Morgantown, WV 26505 and is currently estimated at $723,223, approximately $214 per square foot. 478 Pythian St is a home located in Monongalia County with nearby schools including Suncrest Elementary School, Suncrest Middle School, and Morgantown High School.
Ownership History
Date
Name
Owned For
Owner Type
Purchase Details
Closed on
Feb 14, 2025
Sold by
Koonz Jeffrey Francis and Koonz Maura Ninatte
Bought by
Nysewander Michael Kyle and Nysewander Alexandra Kamburis
Current Estimated Value
Home Financials for this Owner
Home Financials are based on the most recent Mortgage that was taken out on this home.
Original Mortgage
$654,295
Outstanding Balance
$648,473
Interest Rate
5.5%
Mortgage Type
New Conventional
Estimated Equity
$74,750
Purchase Details
Closed on
Feb 28, 2020
Sold by
Dering Adrianne L
Bought by
Koonz Jeffrey Francis and Koonz Maura Ninatte
Home Financials for this Owner
Home Financials are based on the most recent Mortgage that was taken out on this home.
Original Mortgage
$637,050
Interest Rate
3.37%
Mortgage Type
New Conventional
Purchase Details
Closed on
Jul 2, 2018
Sold by
Davidson Ann Gunderson and Davis Lloyd Moore
Bought by
Dering Adrianne L
Create a Home Valuation Report for This Property
The Home Valuation Report is an in-depth analysis detailing your home's value as well as a comparison with similar homes in the area
Home Values in the Area
Average Home Value in this Area
Purchase History
| Date | Buyer | Sale Price | Title Company |
|---|---|---|---|
| Nysewander Michael Kyle | $733,000 | None Listed On Document | |
| Nysewander Michael Kyle | $733,000 | None Listed On Document | |
| Koonz Jeffrey Francis | $685,000 | None Available | |
| Dering Adrianne L | $265,000 | None Available |
Source: Public Records
Mortgage History
| Date | Status | Borrower | Loan Amount |
|---|---|---|---|
| Open | Nysewander Michael Kyle | $654,295 | |
| Closed | Nysewander Michael Kyle | $654,295 | |
| Previous Owner | Koonz Jeffrey Francis | $637,050 |
Source: Public Records
Tax History Compared to Growth
Tax History
| Year | Tax Paid | Tax Assessment Tax Assessment Total Assessment is a certain percentage of the fair market value that is determined by local assessors to be the total taxable value of land and additions on the property. | Land | Improvement |
|---|---|---|---|---|
| 2025 | $3,243 | $246,000 | $31,740 | $214,260 |
| 2024 | $3,243 | $246,000 | $31,740 | $214,260 |
| 2023 | $3,236 | $241,200 | $31,740 | $209,460 |
| 2022 | $3,027 | $237,420 | $31,740 | $205,680 |
| 2021 | $2,965 | $231,660 | $31,740 | $199,920 |
| 2020 | $1,551 | $120,720 | $31,740 | $88,980 |
| 2019 | $1,122 | $106,860 | $31,740 | $75,120 |
| 2018 | $1,125 | $106,860 | $31,740 | $75,120 |
| 2017 | $1,024 | $98,760 | $29,940 | $68,820 |
| 2016 | $997 | $96,240 | $27,420 | $68,820 |
| 2015 | $961 | $96,240 | $27,420 | $68,820 |
| 2014 | $1,048 | $106,320 | $26,340 | $79,980 |
Source: Public Records
Map
Nearby Homes
- 478 Legion St
- 490 Rebecca St
- 1287 Broadview Dr
- 3356 Collins Ferry Rd
- 8 French Quarters Dr
- 563 Killarney Dr
- 481 Meridan St
- 529 Aspen St
- 34 Salthouse Ln
- 3445 Collins Ferry Rd
- 649 Villa Place
- 292 Lilly St
- 1360-1362 Bitonti St
- 1362 Bitonti St
- 532 & 532 1/2 Herman Ave
- 600 Herman Ave
- 420 Herman Ave
- 1053 Takoma St
- 101 Forest Dr
- 337 Patteson Dr