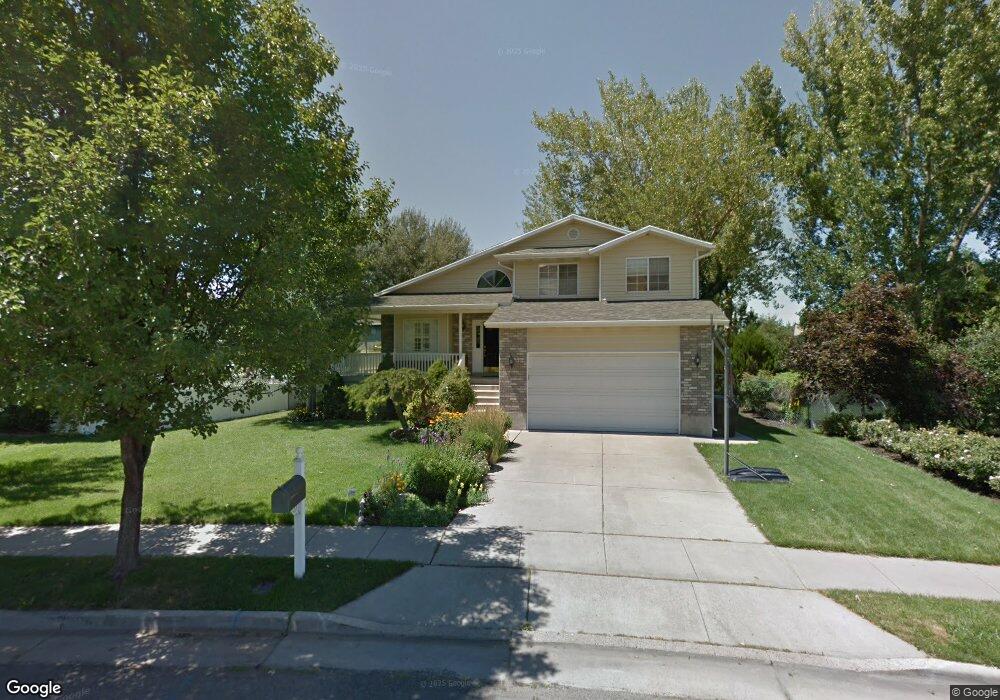
478 Windsor Ln Centerville, UT 84014
Estimated Value: $522,000 - $642,000
3
Beds
2
Baths
1,678
Sq Ft
$349/Sq Ft
Est. Value
About This Home
This home is located at 478 Windsor Ln, Centerville, UT 84014 and is currently estimated at $585,873, approximately $349 per square foot. 478 Windsor Ln is a home located in Davis County with nearby schools including J A Taylor Elementary School, Centerville Jr High, and Viewmont High School.
Ownership History
Date
Name
Owned For
Owner Type
Purchase Details
Closed on
Jul 2, 2025
Sold by
Frandsen Bradley W and Frandsen Kim A
Bought by
Frandsen Family Trust and Frandsen
Current Estimated Value
Purchase Details
Closed on
Feb 5, 2014
Sold by
Frandsen Bradley W and Frandsen Kim A
Bought by
Frandsen Bradley W and Frandsen Kim A
Home Financials for this Owner
Home Financials are based on the most recent Mortgage that was taken out on this home.
Original Mortgage
$208,000
Interest Rate
4.46%
Mortgage Type
New Conventional
Purchase Details
Closed on
Apr 13, 2005
Sold by
Shingleton Brent A and Shingleton Stacey A
Bought by
Frandsen Bradley W and Frandsen Kim A
Home Financials for this Owner
Home Financials are based on the most recent Mortgage that was taken out on this home.
Original Mortgage
$37,000
Interest Rate
5.84%
Mortgage Type
Credit Line Revolving
Create a Home Valuation Report for This Property
The Home Valuation Report is an in-depth analysis detailing your home's value as well as a comparison with similar homes in the area
Purchase History
| Date | Buyer | Sale Price | Title Company |
|---|---|---|---|
| Frandsen Family Trust | -- | None Listed On Document | |
| Frandsen Bradley W | -- | Accommodation | |
| Frandsen Bradley W | -- | None Available |
Source: Public Records
Mortgage History
| Date | Status | Borrower | Loan Amount |
|---|---|---|---|
| Previous Owner | Frandsen Bradley W | $208,000 | |
| Previous Owner | Frandsen Bradley W | $37,000 | |
| Previous Owner | Frandsen Bradley W | $166,800 |
Source: Public Records
Tax History
| Year | Tax Paid | Tax Assessment Tax Assessment Total Assessment is a certain percentage of the fair market value that is determined by local assessors to be the total taxable value of land and additions on the property. | Land | Improvement |
|---|---|---|---|---|
| 2025 | $2,869 | $274,450 | $160,148 | $114,302 |
| 2024 | $2,765 | $268,950 | $143,190 | $125,760 |
| 2023 | $2,662 | $468,000 | $235,868 | $232,132 |
| 2022 | $2,795 | $270,600 | $118,898 | $151,702 |
| 2021 | $2,520 | $380,000 | $180,289 | $199,711 |
| 2020 | $2,282 | $344,000 | $176,716 | $167,284 |
| 2019 | $2,343 | $345,000 | $179,271 | $165,729 |
| 2018 | $2,179 | $317,000 | $166,466 | $150,534 |
| 2016 | $1,821 | $147,180 | $52,715 | $94,465 |
| 2015 | $1,775 | $135,355 | $52,715 | $82,640 |
| 2014 | $1,861 | $145,220 | $52,715 | $92,505 |
| 2013 | -- | $118,049 | $39,971 | $78,078 |
Source: Public Records
Map
Nearby Homes
- 330 W Paradiso Ln
- 204 Lyman Ln
- 324 S 600 W
- 287 S 680 W Unit 9
- 83 W 850 S
- 88 W 50 S Unit A4
- 88 W 50 S Unit C-3
- 88 W 50 S Unit B5
- 951 Centerville Commons Way
- 328 W Pages Ln
- 96 Village Square Rd
- 147 N 360 W Unit 21
- 967 S Courtyard Ln
- 56 W 200 N
- 345 E 600 S
- 235 W 1400 N
- 1520 N 550 W
- 1767 N 600 W
- 1420 N Main St
- 328 E 1100 S
Your Personal Tour Guide
Ask me questions while you tour the home.