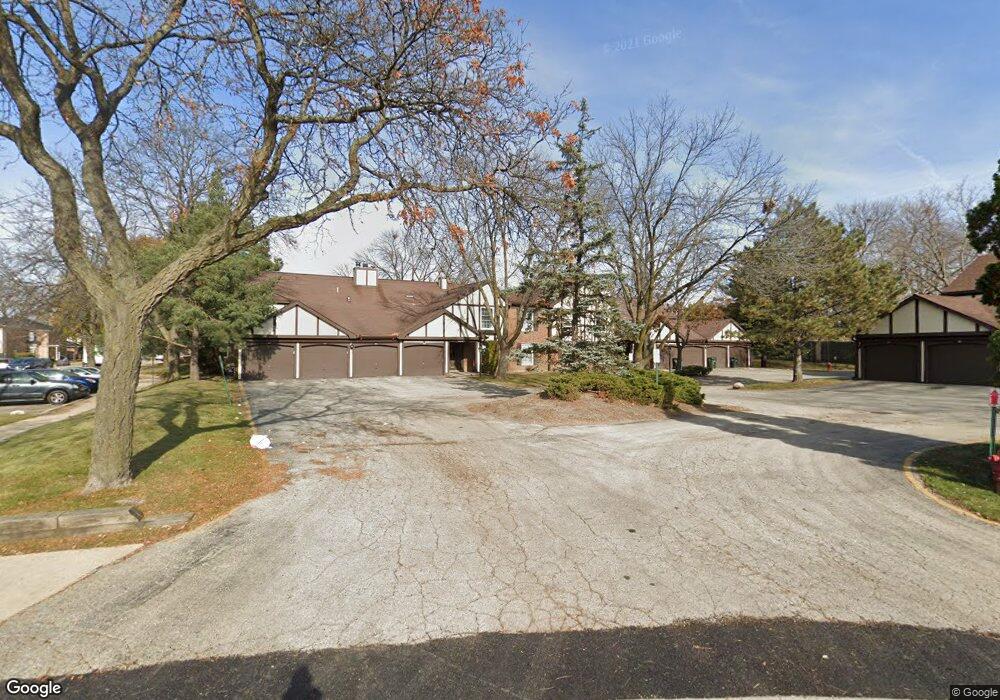
4780 Calvert Dr Rolling Meadows, IL 60008
Busse Woods NeighborhoodEstimated Value: $267,625 - $297,000
2
Beds
2
Baths
1,300
Sq Ft
$218/Sq Ft
Est. Value
About This Home
This home is located at 4780 Calvert Dr, Rolling Meadows, IL 60008 and is currently estimated at $283,906, approximately $218 per square foot. 4780 Calvert Dr is a home located in Cook County with nearby schools including Willow Bend Elementary School, Carl Sandburg Junior High School, and Rolling Meadows High School.
Ownership History
Date
Name
Owned For
Owner Type
Purchase Details
Closed on
Mar 9, 2017
Sold by
Levites Dmitry and Levites Nuriana
Bought by
Shpak Yehor
Current Estimated Value
Home Financials for this Owner
Home Financials are based on the most recent Mortgage that was taken out on this home.
Original Mortgage
$144,000
Outstanding Balance
$69,918
Interest Rate
3.75%
Mortgage Type
New Conventional
Estimated Equity
$213,988
Purchase Details
Closed on
Jan 23, 2014
Sold by
Godes Nataly and Kavalenka Siarhei
Bought by
Levites Dmitry
Home Financials for this Owner
Home Financials are based on the most recent Mortgage that was taken out on this home.
Original Mortgage
$73,125
Interest Rate
4.49%
Mortgage Type
New Conventional
Purchase Details
Closed on
Jun 1, 2007
Sold by
Getz Steven P
Bought by
Godes Nataly
Create a Home Valuation Report for This Property
The Home Valuation Report is an in-depth analysis detailing your home's value as well as a comparison with similar homes in the area
Home Values in the Area
Average Home Value in this Area
Purchase History
| Date | Buyer | Sale Price | Title Company |
|---|---|---|---|
| Shpak Yehor | $160,000 | Ct | |
| Shpak Yehor | $160,000 | Ct | |
| Levites Dmitry | -- | Fidelity | |
| Levites Dmitry | -- | Fidelity | |
| Godes Nataly | $160,000 | First American Title Ins Co | |
| Godes Nataly | $160,000 | First American Title Ins Co |
Source: Public Records
Mortgage History
| Date | Status | Borrower | Loan Amount |
|---|---|---|---|
| Open | Shpak Yehor | $144,000 | |
| Previous Owner | Levites Dmitry | $73,125 |
Source: Public Records
Tax History
| Year | Tax Paid | Tax Assessment Tax Assessment Total Assessment is a certain percentage of the fair market value that is determined by local assessors to be the total taxable value of land and additions on the property. | Land | Improvement |
|---|---|---|---|---|
| 2025 | $4,267 | $22,489 | $3,707 | $18,782 |
| 2024 | $4,267 | $17,289 | $3,121 | $14,168 |
| 2023 | $4,052 | $17,289 | $3,121 | $14,168 |
| 2022 | $4,052 | $17,289 | $3,121 | $14,168 |
| 2021 | $2,409 | $10,643 | $2,048 | $8,595 |
| 2020 | $2,426 | $10,643 | $2,048 | $8,595 |
| 2019 | $2,459 | $11,929 | $2,048 | $9,881 |
| 2018 | $2,735 | $11,917 | $1,755 | $10,162 |
| 2017 | $3,764 | $11,917 | $1,755 | $10,162 |
| 2016 | $3,506 | $11,917 | $1,755 | $10,162 |
| 2015 | $4,123 | $13,163 | $1,560 | $11,603 |
| 2014 | $3,240 | $13,163 | $1,560 | $11,603 |
| 2013 | $3,144 | $13,163 | $1,560 | $11,603 |
Source: Public Records
Map
Nearby Homes
- 2508 Algonquin Rd Unit 16
- 2504 Algonquin Rd Unit 14
- 5000 Carriageway Dr Unit 305
- 5000 Carriageway Dr Unit 211
- 5001 Carriage Way Dr Unit 116
- 5201 Carriageway Dr Unit C317
- 1227 S Old Wilke Rd Unit 306
- 1363 S Old Wilke Rd Unit 27
- 1117 S Old Wilke Rd Unit 206
- 1107 S Old Wilke Rd Unit 103
- 1107 S Old Wilke Rd Unit 208
- 1126 S New Wilke Rd Unit 307
- 1322 S New Wilke Rd Unit 1C
- 2302 Fulle St
- 5400 Astor Ln Unit 116
- 5450 Astor Ln Unit 104
- 5450 Astor Ln Unit 415
- 3712 Jay Ln
- 1302 S Princeton Ave
- 1418 S Princeton Ave
- 4780 Calvert Dr Unit B1
- 4780 Calvert Dr Unit B2
- 4780 Calvert Dr Unit 4C1
- 4780 Calvert Dr Unit 4B1
- 4780 Calvert Dr Unit 4D2
- 4780 Calvert Dr Unit 4B2
- 4780 Calvert Dr Unit 4C2
- 4780 Calvert Dr Unit 4D1
- 4780 Calvert Dr Unit 4A2
- 4780 Calvert Dr Unit 4A1
- 4780 Calvert Dr Unit D2
- 4780 Calvert Dr Unit D1
- 4780 Calvert Dr Unit C2
- 4780 Calvert Dr Unit C-1
- 4780 Calvert Dr Unit 1B
- 4780 Calvert Dr Unit A1
- 4770 Calvert Dr Unit 5A2
- 4770 Calvert Dr Unit 5A1
- 4770 Calvert Dr Unit 5C1
- 4770 Calvert Dr Unit 5D2
Your Personal Tour Guide
Ask me questions while you tour the home.