Estimated Value: $290,000 - $348,000
3
Beds
2
Baths
2,736
Sq Ft
$115/Sq Ft
Est. Value
About This Home
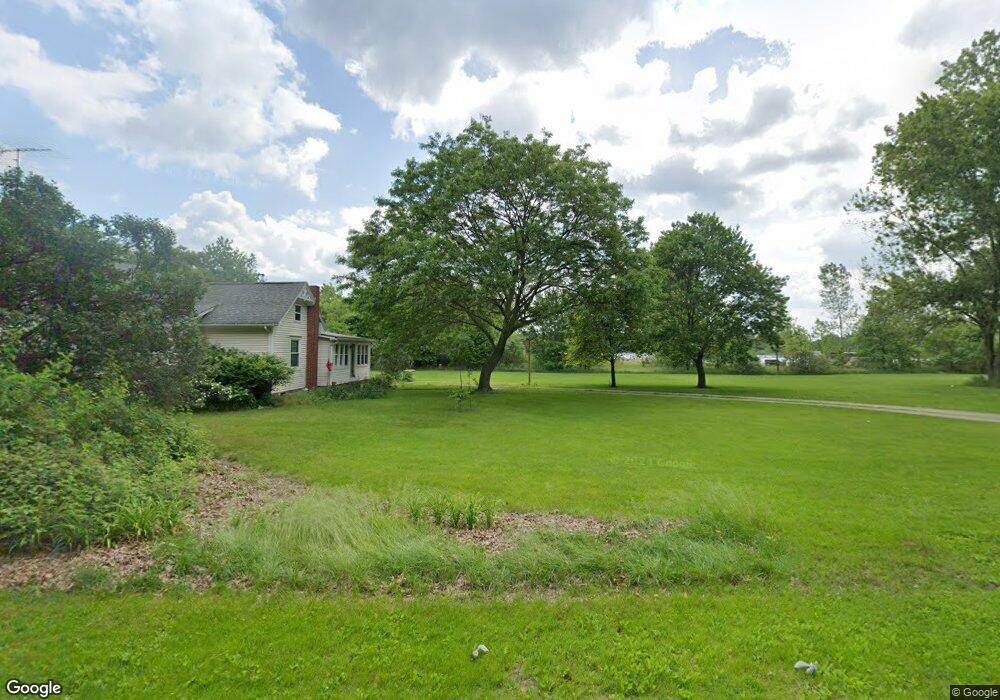
This home is located at 4780 County Road 5 2, Delta, OH 43515 and is currently estimated at $314,076, approximately $114 per square foot. 4780 County Road 5 2 is a home located in Fulton County with nearby schools including Delta Elementary School, Pike-Delta-York Middle School, and Pike-Delta-York High School.
Ownership History
Date
Name
Owned For
Owner Type
Purchase Details
Closed on
Mar 25, 2022
Sold by
Neipp Lawrence A and Neipp Julie R
Bought by
Neipp Lawrence A and Neipp Julie R
Current Estimated Value
Purchase Details
Closed on
Aug 24, 2013
Sold by
Neipp Jennifer
Bought by
Neipp Lawrence A
Purchase Details
Closed on
Nov 30, 2009
Sold by
Neipp Lawrence A and Neipp Jennifer
Bought by
Irwin Karen K and Irwin James
Purchase Details
Closed on
Nov 28, 2009
Sold by
Irwin Karen K and Irwin James
Bought by
Neipp Lawrence A and Neipp Jennifer
Purchase Details
Closed on
Nov 5, 2009
Sold by
Neipp Frederick and Neipp Judith C
Bought by
Irwin Karen K and Neipp Lawrence A
Purchase Details
Closed on
Jan 1, 1990
Sold by
Burgin Irving
Bought by
Neipp Frederick
Create a Home Valuation Report for This Property
The Home Valuation Report is an in-depth analysis detailing your home's value as well as a comparison with similar homes in the area
Home Values in the Area
Average Home Value in this Area
Purchase History
| Date | Buyer | Sale Price | Title Company |
|---|---|---|---|
| Neipp Lawrence A | -- | David R Maxson Ps | |
| Neipp Lawrence A | -- | Attorney | |
| Irwin Karen K | -- | Attorney | |
| Neipp Lawrence A | -- | Attorney | |
| Irwin Karen K | -- | Attorney | |
| Irwin Karen K | -- | None Available | |
| Neipp Frederick | -- | -- |
Source: Public Records
Tax History Compared to Growth
Tax History
| Year | Tax Paid | Tax Assessment Tax Assessment Total Assessment is a certain percentage of the fair market value that is determined by local assessors to be the total taxable value of land and additions on the property. | Land | Improvement |
|---|---|---|---|---|
| 2024 | $3,823 | $97,620 | $9,170 | $88,450 |
| 2023 | $4,102 | $97,620 | $9,170 | $88,450 |
| 2022 | $3,632 | $73,150 | $7,630 | $65,520 |
| 2021 | $3,699 | $73,150 | $7,630 | $65,520 |
| 2020 | $3,743 | $73,150 | $7,630 | $65,520 |
| 2019 | $3,110 | $63,000 | $7,490 | $55,510 |
| 2018 | $1,649 | $63,000 | $7,490 | $55,510 |
| 2017 | $1,676 | $63,000 | $7,490 | $55,510 |
| 2016 | $2,984 | $59,330 | $7,490 | $51,840 |
| 2015 | $2,892 | $59,330 | $7,490 | $51,840 |
| 2014 | $2,864 | $59,330 | $7,490 | $51,840 |
| 2013 | $3,129 | $64,650 | $8,230 | $56,420 |
Source: Public Records
Map
Nearby Homes
- 4329 County Road 1 #2
- 3121 County Road Ef
- 518 Providence St
- 701 Palmwood St
- 908 Fernwood St
- 305 Mckinley St
- 1797 County Road 5
- 207 Wood St
- 2121 County Road 4
- 413 Fernwood St
- 308 Monroe St
- 2511 County Road D
- 201 Elmwood Ave
- 6854 County Road 3
- 2076 County Rd E
- 810 Greenview Ave
- 2239 County Road 3
- 1932 County Road D
- 1568 County Road D
- 2121 Holiday Dr
- 4810 County Road 5 2
- 4646 County Road E Unit 5-2
- 4646 County Road 5 2
- 4615 County Road E Unit 5-2
- 4615 County Road 5 2
- 4938 County Road 5 2
- 5521 County Road E
- 5521 County Rd E
- 5571 Co Rd E
- 5571 County Road E
- 4539 County Road 5-2
- 5657 County Road E
- 5657 County Rd E
- 5657 County Rd E Unit E
- 4539 County Road E Unit 5-2
- 4518 County Road E Unit 5-2
- 5681 County Road E
- 5616 County Road E
- 5590 County Road E
- 4466 County Road E Unit 5-2