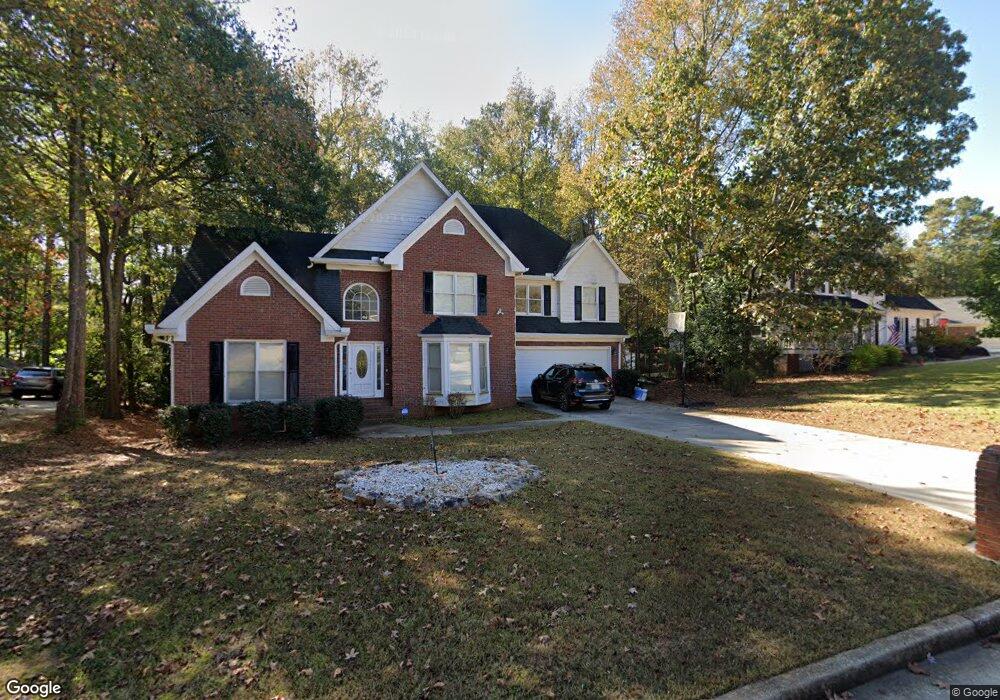
4781 Habersham Way SE Conyers, GA 30094
Estimated Value: $323,000 - $395,000
4
Beds
3
Baths
2,367
Sq Ft
$151/Sq Ft
Est. Value
About This Home
This home is located at 4781 Habersham Way SE, Conyers, GA 30094 and is currently estimated at $357,203, approximately $150 per square foot. 4781 Habersham Way SE is a home located in Rockdale County with nearby schools including Barksdale Elementary School, Gen. Ray Davis Middle School, and Salem High School.
Ownership History
Date
Name
Owned For
Owner Type
Purchase Details
Closed on
Jul 14, 2021
Sold by
Smith Lanza P
Bought by
Harris Tierra
Current Estimated Value
Purchase Details
Closed on
Mar 29, 2010
Sold by
Bank Of Ny Cwmbs 2003-30
Bought by
Harris Tierra and Smith Lanza
Home Financials for this Owner
Home Financials are based on the most recent Mortgage that was taken out on this home.
Original Mortgage
$138,351
Interest Rate
5.5%
Mortgage Type
FHA
Purchase Details
Closed on
Jul 7, 2009
Sold by
Winders Timothy and Winders Lori
Bought by
2003-30 Cwmbs
Purchase Details
Closed on
Oct 25, 1994
Sold by
Hg Pennington Constr
Bought by
Winders Timothy
Create a Home Valuation Report for This Property
The Home Valuation Report is an in-depth analysis detailing your home's value as well as a comparison with similar homes in the area
Home Values in the Area
Average Home Value in this Area
Purchase History
| Date | Buyer | Sale Price | Title Company |
|---|---|---|---|
| Harris Tierra | -- | -- | |
| Harris Tierra | $140,904 | -- | |
| 2003-30 Cwmbs | $163,398 | -- | |
| Winders Timothy | $136,900 | -- |
Source: Public Records
Mortgage History
| Date | Status | Borrower | Loan Amount |
|---|---|---|---|
| Previous Owner | Harris Tierra | $138,351 | |
| Closed | Winders Timothy | -- |
Source: Public Records
Tax History Compared to Growth
Tax History
| Year | Tax Paid | Tax Assessment Tax Assessment Total Assessment is a certain percentage of the fair market value that is determined by local assessors to be the total taxable value of land and additions on the property. | Land | Improvement |
|---|---|---|---|---|
| 2024 | $5,350 | $134,880 | $25,360 | $109,520 |
| 2023 | $4,742 | $116,160 | $26,400 | $89,760 |
| 2022 | $4,099 | $99,960 | $22,640 | $77,320 |
| 2021 | $3,540 | $86,800 | $17,040 | $69,760 |
| 2020 | $3,323 | $77,560 | $13,560 | $64,000 |
| 2019 | $2,897 | $64,160 | $10,840 | $53,320 |
| 2018 | $2,676 | $58,960 | $9,680 | $49,280 |
| 2017 | $2,107 | $45,920 | $8,680 | $37,240 |
| 2016 | $2,107 | $45,920 | $8,680 | $37,240 |
| 2015 | $2,109 | $45,920 | $8,680 | $37,240 |
| 2014 | $2,100 | $45,240 | $8,000 | $37,240 |
| 2013 | -- | $60,320 | $12,000 | $48,320 |
Source: Public Records
Map
Nearby Homes
- 4797 Hemlock Dr SE
- 4740 Shadybrook Way SE
- 4811 W Lake Dr SE
- 4970 Hull Rd SE
- 4731 Shadybrook Way SE Unit 2
- 4931 W Lake Dr SE
- 1459 Highway 212 SW
- 510 Bell Rd SE Unit 1
- 4938 Lake Forest Dr SE
- 4980 W Lake Dr SE
- 495 Oglesby Bridge Rd SE
- 385 Oglesby Bridge Rd SE
- 570 Bell Rd SE
- 1590 Colonial South Dr SW
- 246 Bridgewood Dr SE
- 2178 NE Hillwood Dr
- 550 Oglesby Bridge Rd SE
- 1023 Plantation Ct SE
- 634 Knollwood Cir SE
- 801 Greenwood Trail SE
- 4771 Habersham Way SE
- 4771 Habersham Way SE Unit 17
- 4801 Habersham Way SE Unit 3
- 603 San Remo Ct SE
- 4761 Habersham Way SE
- 4811 Habersham Way SE
- 4780 Habersham Way SE Unit 3
- 4770 Habersham Way SE
- 4840 Ridgedale Ln SE Unit 2
- 4790 Habersham Way SE
- 4751 Habersham Way SE Unit 3
- 4821 Habersham Way SE Unit 3
- 4820 Ridgedale Ln SE
- 602 San Remo Ct SE
- 4830 Ridgedale Ln SE
- 4760 Habersham Way SE
- 4800 Habersham Way SE
- 4850 Ridgedale Ln SE Unit 2
- 4741 Habersham Way SE
- 4810 Ridgedale Ln SE