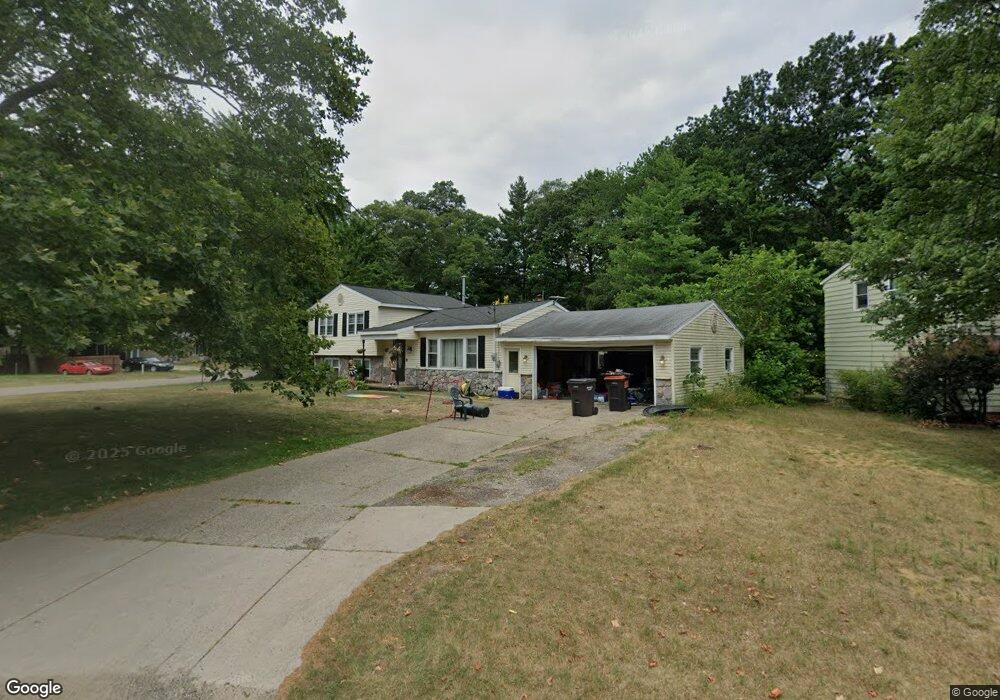
4781 Westshire Dr NW Comstock Park, MI 49321
Estimated Value: $261,000 - $326,000
3
Beds
2
Baths
1,150
Sq Ft
$261/Sq Ft
Est. Value
About This Home
This home is located at 4781 Westshire Dr NW, Comstock Park, MI 49321 and is currently estimated at $299,682, approximately $260 per square foot. 4781 Westshire Dr NW is a home located in Kent County with nearby schools including Stoney Creek Elementary School, Pine Island Elementary School, and Mill Creek Middle School.
Ownership History
Date
Name
Owned For
Owner Type
Purchase Details
Closed on
Jul 22, 2010
Sold by
Secretary Of Housing & Urban Development
Bought by
Nesbitt Brian
Current Estimated Value
Purchase Details
Closed on
Aug 11, 2009
Sold by
Mortgage Electronic Registration Systems
Bought by
U S Department Of Housing & Urban Develo
Purchase Details
Closed on
Jul 8, 2009
Sold by
Milanowski Vicki S
Bought by
Mortgage Electronic Registration Systems
Purchase Details
Closed on
Oct 24, 2005
Sold by
Kahnoski John D and Kahnoski Sharon
Bought by
Milanowski Vicki S
Home Financials for this Owner
Home Financials are based on the most recent Mortgage that was taken out on this home.
Original Mortgage
$148,321
Interest Rate
5.8%
Mortgage Type
FHA
Purchase Details
Closed on
Aug 1, 1974
Bought by
Kahnoski J and Nesbitt Brian M
Create a Home Valuation Report for This Property
The Home Valuation Report is an in-depth analysis detailing your home's value as well as a comparison with similar homes in the area
Home Values in the Area
Average Home Value in this Area
Purchase History
| Date | Buyer | Sale Price | Title Company |
|---|---|---|---|
| Nesbitt Brian | $85,000 | None Available | |
| U S Department Of Housing & Urban Develo | -- | None Available | |
| Mortgage Electronic Registration Systems | $147,615 | None Available | |
| Milanowski Vicki S | $149,500 | -- | |
| Kahnoski J | $27,500 | -- |
Source: Public Records
Mortgage History
| Date | Status | Borrower | Loan Amount |
|---|---|---|---|
| Previous Owner | Milanowski Vicki S | $148,321 |
Source: Public Records
Tax History Compared to Growth
Tax History
| Year | Tax Paid | Tax Assessment Tax Assessment Total Assessment is a certain percentage of the fair market value that is determined by local assessors to be the total taxable value of land and additions on the property. | Land | Improvement |
|---|---|---|---|---|
| 2025 | $2,215 | $160,700 | $0 | $0 |
| 2024 | $2,215 | $138,400 | $0 | $0 |
| 2023 | $2,116 | $126,600 | $0 | $0 |
| 2022 | $2,971 | $112,600 | $0 | $0 |
| 2021 | $2,928 | $100,300 | $0 | $0 |
| 2020 | $1,943 | $89,000 | $0 | $0 |
| 2019 | $2,323 | $73,400 | $0 | $0 |
| 2018 | $2,672 | $73,400 | $0 | $0 |
| 2017 | $2,672 | $72,100 | $0 | $0 |
| 2016 | $2,778 | $69,100 | $0 | $0 |
| 2015 | -- | $69,100 | $0 | $0 |
| 2013 | -- | $62,600 | $0 | $0 |
Source: Public Records
Map
Nearby Homes
- 4678 Westshire Dr NW
- 4893 Stony Creek Ave NW
- 4581 Westshire Dr NW
- 452 Springfield St NW
- 681 Strawberry Valley Ave NW Unit 7
- 33 Star Gazer Ln NE
- 996 Scioto Dr NW Unit 1
- 995 Scioto Dr NW Unit 25
- 997 Scioto Dr NW Unit 26
- 977 Ellerston St NW
- 994 Scioto Dr NW Unit 2
- 4869 Bethpage Dr NW Unit 9
- 510 Clark St NW
- 72 6 Mile Rd NE
- 4154 Woodrush Ln NW Unit 65
- 4010 Woodrush Ln NW Unit 40
- Wilshire Plan at The Range
- Remington Plan at The Range
- Linden Plan at The Range
- Enclave Plan at The Range
- 4793 Westshire Dr NW
- 465 Shadowood St NW
- 4755 Westshire Dr NW
- 4805 Westshire Dr NW
- 4778 Westshire Dr NW
- 4788 Westshire Dr NW
- 479 Shadowood St NW
- 464 Shadowood St NW
- 4800 Westshire Dr NW
- 4766 Westshire Dr NW
- 478 Shadowood St NW
- 4737 Westshire Dr NW
- 4754 Westshire Dr NW
- 491 Shadowood St NW
- 4810 Westshire Dr NW
- 4821 Westshire Dr NW
- 4929 Kittery Ct NW
- 4937 Kittery Ct NW
- 4929 Kittery Dr NW
- 490 Shadowood St NW