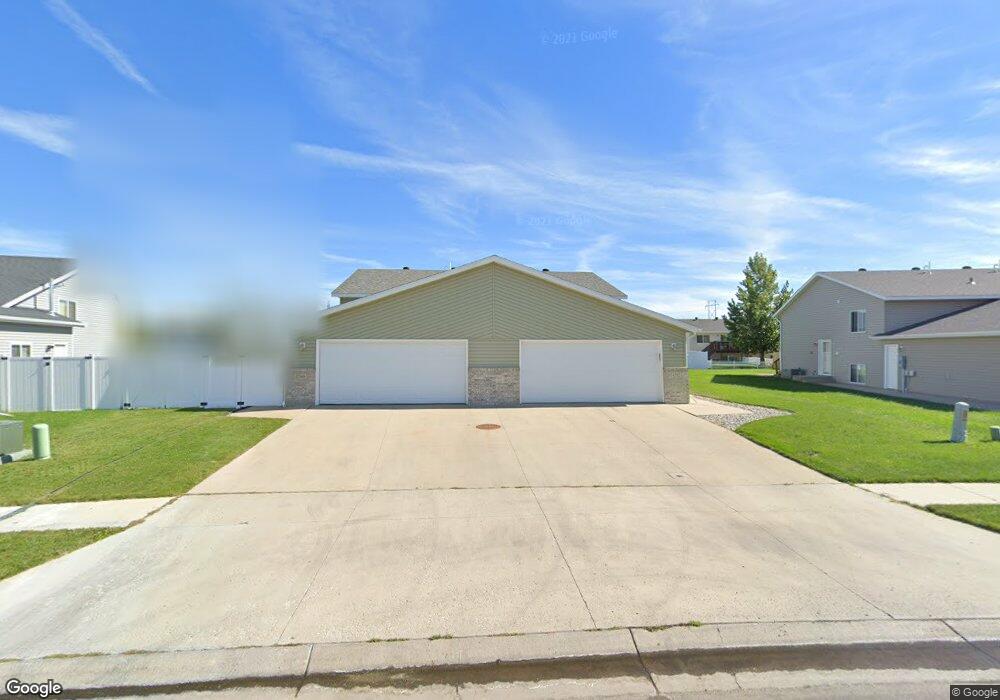
4782 Harvest Dr S Fargo, ND 58104
Osgood NeighborhoodEstimated Value: $269,000 - $275,512
3
Beds
2
Baths
1,672
Sq Ft
$163/Sq Ft
Est. Value
About This Home
This home is located at 4782 Harvest Dr S, Fargo, ND 58104 and is currently estimated at $272,378, approximately $162 per square foot. 4782 Harvest Dr S is a home located in Cass County with nearby schools including Osgood Elementary School, Liberty Middle School, and West Fargo Sheyenne High School.
Ownership History
Date
Name
Owned For
Owner Type
Purchase Details
Closed on
Aug 13, 2021
Sold by
Stahlecker Travis L and Stahlecker Heather
Bought by
Lenoue Ryan
Current Estimated Value
Home Financials for this Owner
Home Financials are based on the most recent Mortgage that was taken out on this home.
Original Mortgage
$172,000
Outstanding Balance
$156,401
Interest Rate
2.9%
Mortgage Type
New Conventional
Estimated Equity
$115,977
Purchase Details
Closed on
Jul 1, 2016
Sold by
Knudtson Daniel C and Knudtson Erin M
Bought by
Stahlecker Travis L
Home Financials for this Owner
Home Financials are based on the most recent Mortgage that was taken out on this home.
Original Mortgage
$150,000
Interest Rate
3.58%
Mortgage Type
New Conventional
Purchase Details
Closed on
Nov 17, 2006
Sold by
Ltd Corporation
Bought by
Kundtson Daniel C
Home Financials for this Owner
Home Financials are based on the most recent Mortgage that was taken out on this home.
Original Mortgage
$116,650
Interest Rate
6.4%
Mortgage Type
FHA
Create a Home Valuation Report for This Property
The Home Valuation Report is an in-depth analysis detailing your home's value as well as a comparison with similar homes in the area
Home Values in the Area
Average Home Value in this Area
Purchase History
| Date | Buyer | Sale Price | Title Company |
|---|---|---|---|
| Lenoue Ryan | $215,000 | Fm Title | |
| Stahlecker Travis L | $170,000 | Fargo Title Inc | |
| Kundtson Daniel C | -- | -- |
Source: Public Records
Mortgage History
| Date | Status | Borrower | Loan Amount |
|---|---|---|---|
| Open | Lenoue Ryan | $172,000 | |
| Previous Owner | Stahlecker Travis L | $150,000 | |
| Previous Owner | Kundtson Daniel C | $116,650 |
Source: Public Records
Tax History Compared to Growth
Tax History
| Year | Tax Paid | Tax Assessment Tax Assessment Total Assessment is a certain percentage of the fair market value that is determined by local assessors to be the total taxable value of land and additions on the property. | Land | Improvement |
|---|---|---|---|---|
| 2024 | $3,324 | $119,550 | $21,500 | $98,050 |
| 2023 | $3,531 | $108,800 | $18,700 | $90,100 |
| 2022 | $3,510 | $101,700 | $18,700 | $83,000 |
| 2021 | $3,298 | $92,450 | $18,700 | $73,750 |
| 2020 | $3,304 | $88,050 | $18,700 | $69,350 |
| 2019 | $3,190 | $88,050 | $10,400 | $77,650 |
| 2018 | $3,125 | $88,050 | $10,400 | $77,650 |
| 2017 | $2,947 | $82,900 | $10,400 | $72,500 |
| 2016 | $2,722 | $72,100 | $10,400 | $61,700 |
| 2015 | $2,786 | $72,100 | $7,800 | $64,300 |
| 2014 | $2,802 | $70,000 | $7,800 | $62,200 |
| 2013 | $2,667 | $66,650 | $7,800 | $58,850 |
Source: Public Records
Map
Nearby Homes
- 4780 Harvest Dr S
- 4792 Harvest Dr S
- 4762 Harvest Dr S
- 4771 52nd St S
- 4781 52nd St S
- 4769 52nd St S
- 4783 52nd St S
- 4777 Harvest Dr S
- 4757 52nd St S
- 4795 Harvest Dr S
- 4795 52nd St S
- 4748 Harvest Dr S
- 4797 52nd St S
- 4793 Harvest Dr S
- 4745 52nd St S
- 4736 Harvest Dr S
- 4761 Harvest Dr S
- 5230 48th Ave S
- 5254 48th Ave S
- 5228 48th Ave S