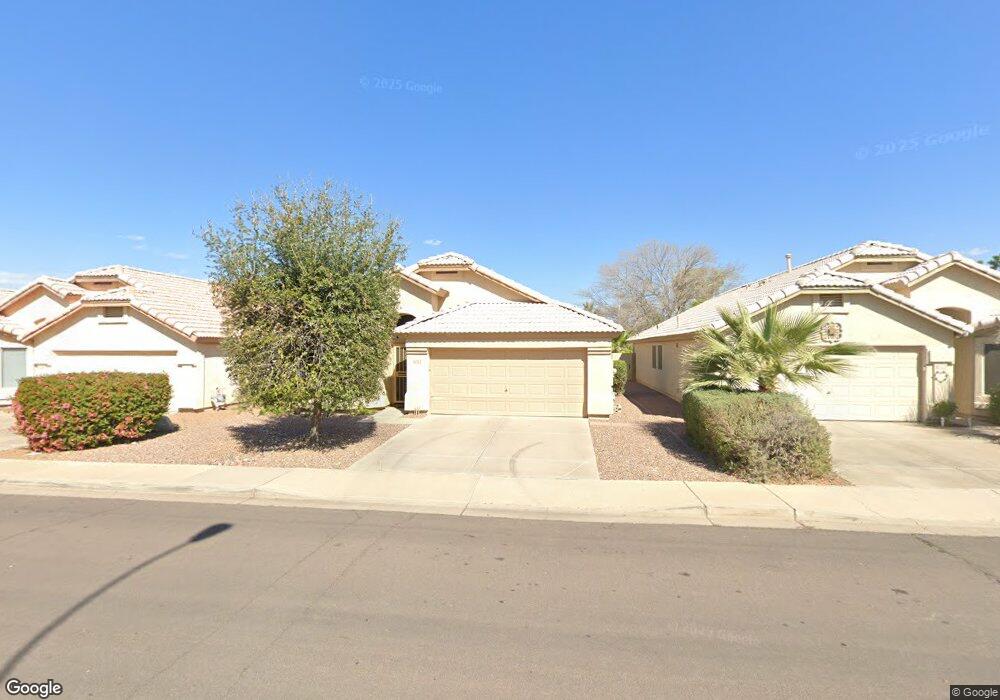
4782 W Harrison St Chandler, AZ 85226
West Chandler NeighborhoodEstimated Value: $415,861 - $531,000
--
Bed
3
Baths
1,614
Sq Ft
$295/Sq Ft
Est. Value
About This Home
This home is located at 4782 W Harrison St, Chandler, AZ 85226 and is currently estimated at $476,715, approximately $295 per square foot. 4782 W Harrison St is a home located in Maricopa County with nearby schools including Kyrene de las Brisas Elementary School, Kyrene Aprende Middle School, and Corona Del Sol High School.
Ownership History
Date
Name
Owned For
Owner Type
Purchase Details
Closed on
Aug 30, 2012
Sold by
Barnes Kathy S
Bought by
Barnes Kathy S and The Kathy S Barnes Trust
Current Estimated Value
Purchase Details
Closed on
Sep 14, 2005
Sold by
Beaudine Dena M
Bought by
Beaudine Robert J
Purchase Details
Closed on
Mar 17, 1999
Sold by
Gagnon Carolyn Gip
Bought by
Barnes Kathy S
Home Financials for this Owner
Home Financials are based on the most recent Mortgage that was taken out on this home.
Original Mortgage
$130,600
Outstanding Balance
$31,554
Interest Rate
6.73%
Mortgage Type
New Conventional
Estimated Equity
$445,161
Purchase Details
Closed on
Nov 27, 1998
Sold by
Bohm Edward and Bohm Shirley J
Bought by
Bohm Edward and Bohm Shirley J
Purchase Details
Closed on
Mar 28, 1994
Sold by
D R Horton Inc
Bought by
Gagnon Carolyn Gip
Home Financials for this Owner
Home Financials are based on the most recent Mortgage that was taken out on this home.
Original Mortgage
$86,417
Interest Rate
7.15%
Mortgage Type
FHA
Create a Home Valuation Report for This Property
The Home Valuation Report is an in-depth analysis detailing your home's value as well as a comparison with similar homes in the area
Home Values in the Area
Average Home Value in this Area
Purchase History
| Date | Buyer | Sale Price | Title Company |
|---|---|---|---|
| Barnes Kathy S | -- | None Available | |
| Beaudine Robert J | -- | Security Title Agency Inc | |
| Barnes Kathy S | $137,500 | Chicago Title Insurance Co | |
| Bohm Edward | -- | -- | |
| Gagnon Carolyn Gip | $103,536 | First American Title |
Source: Public Records
Mortgage History
| Date | Status | Borrower | Loan Amount |
|---|---|---|---|
| Open | Barnes Kathy S | $130,600 | |
| Previous Owner | Gagnon Carolyn Gip | $86,417 |
Source: Public Records
Tax History Compared to Growth
Tax History
| Year | Tax Paid | Tax Assessment Tax Assessment Total Assessment is a certain percentage of the fair market value that is determined by local assessors to be the total taxable value of land and additions on the property. | Land | Improvement |
|---|---|---|---|---|
| 2025 | $1,978 | $24,834 | -- | -- |
| 2024 | $1,892 | $23,652 | -- | -- |
| 2023 | $1,892 | $36,610 | $7,320 | $29,290 |
| 2022 | $1,801 | $27,270 | $5,450 | $21,820 |
| 2021 | $1,899 | $25,420 | $5,080 | $20,340 |
| 2020 | $1,856 | $24,110 | $4,820 | $19,290 |
| 2019 | $1,801 | $22,500 | $4,500 | $18,000 |
| 2018 | $1,742 | $21,150 | $4,230 | $16,920 |
| 2017 | $1,660 | $19,970 | $3,990 | $15,980 |
| 2016 | $1,695 | $18,810 | $3,760 | $15,050 |
| 2015 | $1,564 | $18,410 | $3,680 | $14,730 |
Source: Public Records
Map
Nearby Homes
- 4772 W Joshua Blvd
- 4830 W Shannon Ct
- 4820 W Shannon Ct
- 5170 W Ivanhoe St
- 4804 W Gail Dr
- 4922 W Gail Dr
- 4619 W Orchid Ln
- 5291 W Del Rio St
- 881 N Pineview Dr
- 4174 W Harrison St
- 295 N Rural Rd Unit 160
- 295 N Rural Rd Unit 202
- 843 E Vera Ln
- 4554 W Detroit St
- 802 N Butte Ave
- 9433 S Stanley Place
- 390 N Enterprise Place Unit B37
- 390 N Enterprise Place Unit A6
- 5665 W Galveston St Unit 76
- 4628 W Buffalo St
- 4792 W Harrison St
- 4772 W Harrison St Unit CLEAN+
- 4772 W Harrison St
- 840 N Albert Dr
- 4802 W Harrison St
- 850 N Albert Dr
- 4812 W Harrison St
- 4781 W Harrison St
- 4771 W Harrison St
- 833 N Rita Ct
- 4791 W Harrison St
- 860 N Albert Dr
- 831 N Albert Dr
- 821 N Albert Dr
- 843 N Rita Ct
- 841 N Albert Dr
- 4761 W Harrison St
- 4822 W Harrison St
- 4801 W Harrison St
- 811 N Albert Dr