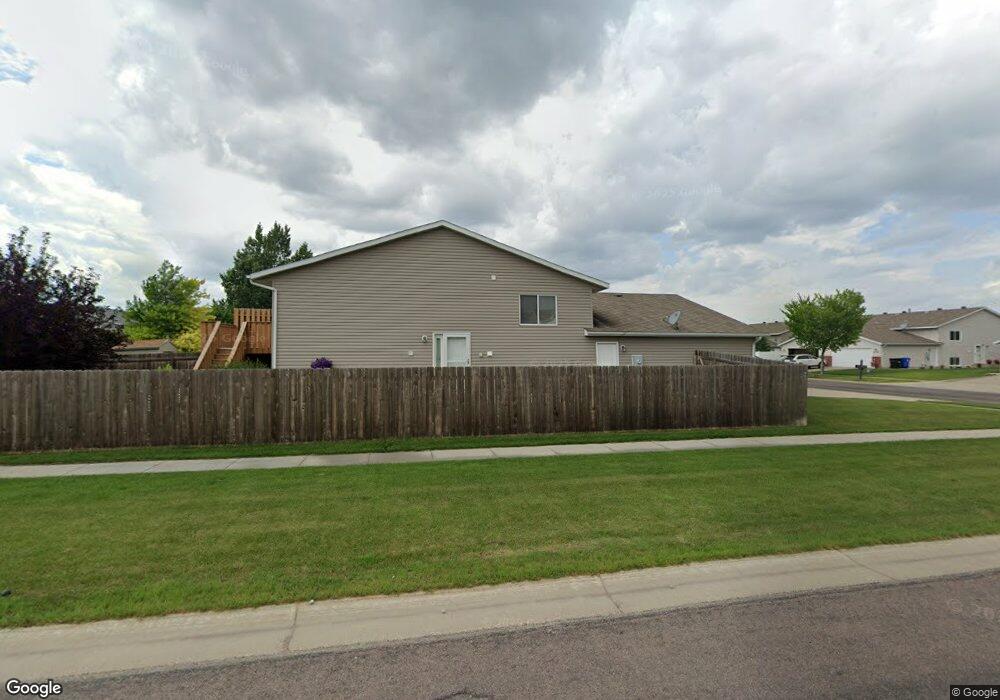
4783 Townsite Place S Fargo, ND 58104
Osgood NeighborhoodEstimated Value: $246,000 - $272,000
3
Beds
2
Baths
1,672
Sq Ft
$157/Sq Ft
Est. Value
About This Home
This home is located at 4783 Townsite Place S, Fargo, ND 58104 and is currently estimated at $262,666, approximately $157 per square foot. 4783 Townsite Place S is a home located in Cass County with nearby schools including Osgood Elementary School, Liberty Middle School, and West Fargo Sheyenne High School.
Ownership History
Date
Name
Owned For
Owner Type
Purchase Details
Closed on
Jul 29, 2016
Sold by
Osborne John R and Osborne Jody L
Bought by
Cowart Carole A
Current Estimated Value
Home Financials for this Owner
Home Financials are based on the most recent Mortgage that was taken out on this home.
Original Mortgage
$140,000
Outstanding Balance
$111,920
Interest Rate
3.54%
Mortgage Type
New Conventional
Estimated Equity
$150,746
Purchase Details
Closed on
Apr 18, 2013
Sold by
Olson Brian O and Olson Carrie S Speer
Bought by
Osborne John R and Osborne Jody L
Home Financials for this Owner
Home Financials are based on the most recent Mortgage that was taken out on this home.
Original Mortgage
$102,675
Interest Rate
3.5%
Mortgage Type
New Conventional
Purchase Details
Closed on
Oct 26, 2009
Sold by
Speer Carrie S and Oslon Brian S
Bought by
Speer Carrie S and Olson Brian S
Create a Home Valuation Report for This Property
The Home Valuation Report is an in-depth analysis detailing your home's value as well as a comparison with similar homes in the area
Home Values in the Area
Average Home Value in this Area
Purchase History
| Date | Buyer | Sale Price | Title Company |
|---|---|---|---|
| Cowart Carole A | $179,900 | None Available | |
| Osborne John R | $136,900 | Us Title | |
| Speer Carrie S | -- | -- |
Source: Public Records
Mortgage History
| Date | Status | Borrower | Loan Amount |
|---|---|---|---|
| Open | Cowart Carole A | $140,000 | |
| Previous Owner | Osborne John R | $102,675 |
Source: Public Records
Tax History Compared to Growth
Tax History
| Year | Tax Paid | Tax Assessment Tax Assessment Total Assessment is a certain percentage of the fair market value that is determined by local assessors to be the total taxable value of land and additions on the property. | Land | Improvement |
|---|---|---|---|---|
| 2024 | $2,381 | $116,300 | $20,750 | $95,550 |
| 2023 | $2,718 | $110,800 | $17,900 | $92,900 |
| 2022 | $2,650 | $103,550 | $17,900 | $85,650 |
| 2021 | $2,434 | $94,150 | $17,900 | $76,250 |
| 2020 | $2,275 | $89,650 | $17,900 | $71,750 |
| 2019 | $2,260 | $89,650 | $9,950 | $79,700 |
| 2018 | $2,194 | $89,650 | $9,950 | $79,700 |
| 2017 | $2,040 | $85,550 | $9,950 | $75,600 |
| 2016 | $1,662 | $74,400 | $9,950 | $64,450 |
| 2015 | $1,740 | $74,400 | $7,450 | $66,950 |
| 2014 | $1,600 | $65,700 | $7,450 | $58,250 |
| 2013 | $1,526 | $62,550 | $7,450 | $55,100 |
Source: Public Records
Map
Nearby Homes
- 4775 Townsite Place S
- 4723 Clock Tower Ln S
- 4758 Townsite Place S
- 4450 48th St S
- 4281 Estate Dr S
- 4110 52nd St S
- 4272 51st St S
- 4127 52nd St S
- 3712 49th St S
- 4245 Coventry Dr S
- 4394 46th Ave S Unit B
- 4318 39 1 2 Ave S
- 4824 Decorah Way S
- 4306 39th Ave S
- 3630 Decorah Way S
- 4293 39 1 2 Ave S
- 1665 3-Stall Plan at The Residence at Valley View Estates
- 3624 Decorah Way
- 4849 Decorah Way S
- 4801 Decorah Way S
- 4781 Townsite Place S
- 4779 Townsite Place S
- 4777 Townsite Place S
- 4705 Clock Tower Ln S
- 4707 Clock Tower Ln S
- 4713 Clock Tower Ln S
- 4715 Clock Tower Ln S
- 4773 Townsite Place S
- 4780 Townsite Place S
- 4778 Townsite Place S
- 4721 Clock Tower Ln S
- 4776 Townsite Place S
- 4771 Townsite Place S
- 4774 Townsite Place S
- 4250 47th St S
- 4769 Townsite Place S
- 4729 Clock Tower Ln S
- 4210 47th St S Unit G
- 4210 47th St S Unit L
- 4210 47th St S