4785 Eagle Watch Dr Flowery Branch, GA 30542
Southeast Gainesville NeighborhoodEstimated Value: $338,000 - $388,000
About This Home
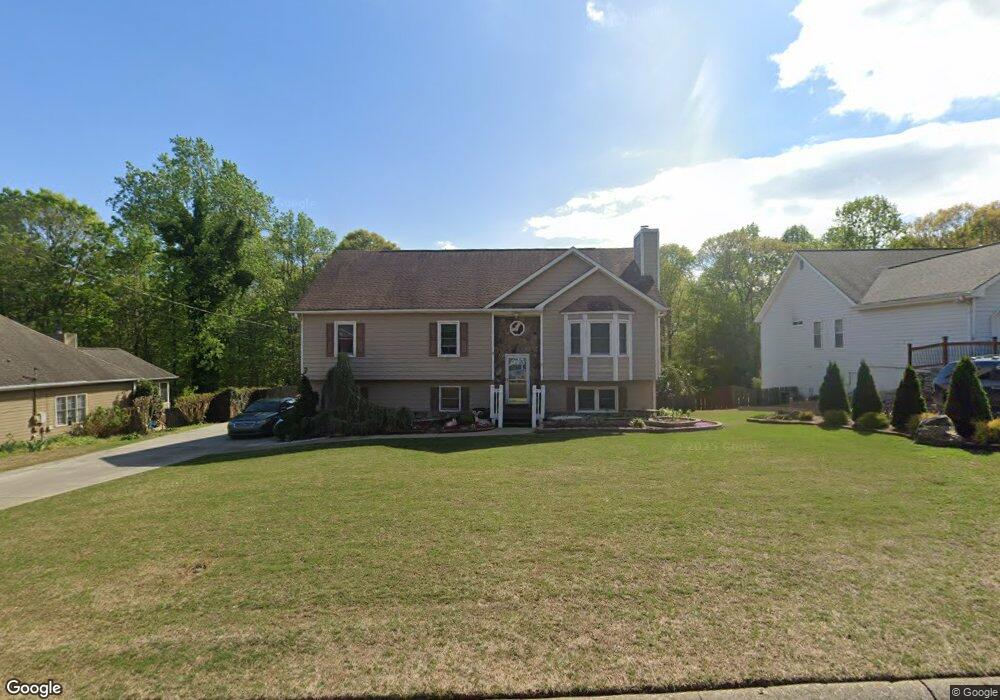
This home is located at 4785 Eagle Watch Dr, Flowery Branch, GA 30542 and is currently estimated at $369,230, approximately $231 per square foot. 4785 Eagle Watch Dr is a home located in Hall County with nearby schools including Martin Elementary School, C.W. Davis Middle School, and Flowery Branch High School.
Ownership History
We collect this data history from publicly available records. To have your information removed, we recommend requesting removal directly through your county’s website.
Purchase Details
Purchase Details
Home Financials for this Owner
Home Financials are based on the most recent Mortgage that was taken out on this home.Purchase Details
Home Financials for this Owner
Home Financials are based on the most recent Mortgage that was taken out on this home.Purchase Details
Purchase Details
Home Values in the Area
Average Home Value in this Area
Purchase History
We collect this data history from publicly available records. To have your information removed, we recommend requesting removal directly through your county’s website.
| Date | Buyer | Sale Price | Title Company |
|---|---|---|---|
| $165,000 | -- | ||
| -- | -- | ||
| $139,400 | -- | ||
| $118,400 | -- | ||
| $18,900 | -- |
Mortgage History
We collect this data history from publicly available records. To have your information removed, we recommend requesting removal directly through your county’s website.
| Date | Status | Borrower | Loan Amount |
|---|---|---|---|
| Previous Owner | $108,700 | ||
| Previous Owner | $91,200 |
Tax History
We collect this data history from publicly available records. To have your information removed, we recommend requesting removal directly through your county’s website.
| Year | Tax Paid | Tax Assessment Tax Assessment Total Assessment is a certain percentage of the fair market value that is determined by local assessors to be the total taxable value of land and additions on the property. | Land | Improvement |
|---|---|---|---|---|
| 2025 | $2,943 | $148,072 | $22,320 | $125,752 |
| 2024 | $3,039 | $119,560 | $21,080 | $98,480 |
| 2023 | $2,622 | $118,360 | $21,320 | $97,040 |
| 2022 | $2,858 | $107,720 | $21,320 | $86,400 |
| 2021 | $2,869 | $105,280 | $19,480 | $85,800 |
| 2020 | $2,465 | $88,208 | $10,400 | $77,808 |
| 2019 | $2,346 | $83,088 | $10,400 | $72,688 |
| 2018 | $2,191 | $74,968 | $9,440 | $65,528 |
| 2017 | $1,659 | $56,728 | $9,440 | $47,288 |
| 2016 | $1,622 | $56,728 | $9,440 | $47,288 |
| 2015 | $1,632 | $56,768 | $9,440 | $47,328 |
| 2014 | $1,632 | $56,768 | $9,440 | $47,328 |
Map
- 4826 Rose Heights Dr
- 6471 Ivy Springs Dr
- 4932 Sunny Ridge Ct
- 4907 Cash Rd
- 5146 Glen Forrest Dr
- 4726 Crestview Way
- 4724 Melbourne Trail
- 4856 Grandview Ct
- 4711 Grandview Pkwy
- 4860 Grandview Ct
- 4864 Grandview Ct
- 6151 Spout Springs Rd
- 4661 Spring Ridge Dr
- 4725 Cardinal Ridge Way
- 4612 Grandview Pkwy
- 5223 Canberra Dr
- 5361 Melbourne Ln
- 4538 Meadowland Way
- 4526 Meadowland Way
- 4514 Meadowland Way
- 4790 Eagle Watch Dr
- 4786 Eagle Watch Dr
- 4794 Eagle Watch Dr
- 4782 Eagle Watch Dr
- 4798 Eagle Watch Dr
- 4828 Eagle Watch Dr
- 4789 Eagle Watch Dr
- 4793 Eagle Watch Dr
- 4778 Eagle Watch Dr
- 4781 Eagle Watch Dr
- 4837 Cash Rd
- 4797 Eagle Watch Dr
- 4829 Cash Rd
- 4849 Cash Rd
- 4802 Eagle Watch Dr
- 4774 Eagle Watch Dr
- 4777 Eagle Watch Dr
- 4805 Eagle Watch Dr
- 4806 Eagle Watch Dr
- 4770 Eagle Watch Dr
Ask me questions while you tour the home.