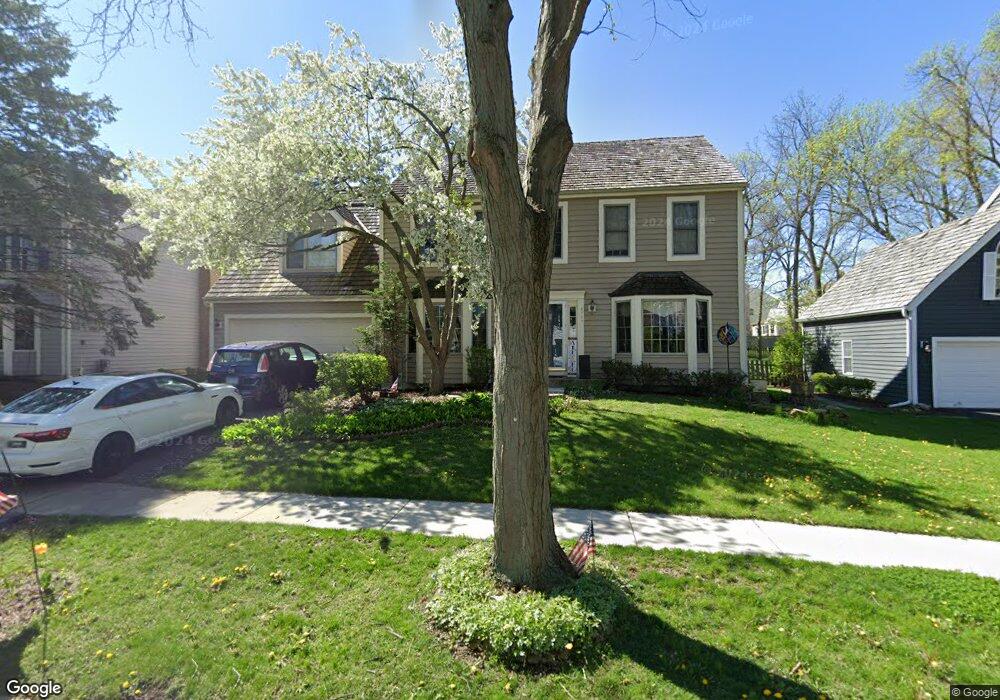
4787 Middle Rd Gurnee, IL 60031
Estimated Value: $514,937 - $571,000
4
Beds
4
Baths
3,152
Sq Ft
$174/Sq Ft
Est. Value
About This Home
This home is located at 4787 Middle Rd, Gurnee, IL 60031 and is currently estimated at $547,484, approximately $173 per square foot. 4787 Middle Rd is a home located in Lake County with nearby schools including Woodland Primary School, Woodland Intermediate School, and Woodland Elementary School.
Ownership History
Date
Name
Owned For
Owner Type
Purchase Details
Closed on
Aug 15, 2000
Sold by
Board Robert L and Board Lynn H
Bought by
Adams Robert C and Howell Adams Becky S
Current Estimated Value
Home Financials for this Owner
Home Financials are based on the most recent Mortgage that was taken out on this home.
Original Mortgage
$241,600
Interest Rate
7.96%
Purchase Details
Closed on
Apr 29, 1999
Sold by
Hatem Dale A and Hatem Patricia A
Bought by
Board Robert and Board Lynn
Home Financials for this Owner
Home Financials are based on the most recent Mortgage that was taken out on this home.
Original Mortgage
$214,750
Interest Rate
7.04%
Mortgage Type
Balloon
Purchase Details
Closed on
Jun 23, 1994
Sold by
Hawxhurst William E and Mcnabb Margaret A
Bought by
Hatem Dale A and Hatem Patricia A
Home Financials for this Owner
Home Financials are based on the most recent Mortgage that was taken out on this home.
Original Mortgage
$219,600
Interest Rate
3.75%
Create a Home Valuation Report for This Property
The Home Valuation Report is an in-depth analysis detailing your home's value as well as a comparison with similar homes in the area
Home Values in the Area
Average Home Value in this Area
Purchase History
| Date | Buyer | Sale Price | Title Company |
|---|---|---|---|
| Adams Robert C | $302,000 | -- | |
| Board Robert | $276,000 | Prairie Title | |
| Hatem Dale A | $244,000 | -- |
Source: Public Records
Mortgage History
| Date | Status | Borrower | Loan Amount |
|---|---|---|---|
| Previous Owner | Adams Robert C | $241,600 | |
| Previous Owner | Board Robert | $214,750 | |
| Previous Owner | Hatem Dale A | $219,600 |
Source: Public Records
Tax History
| Year | Tax Paid | Tax Assessment Tax Assessment Total Assessment is a certain percentage of the fair market value that is determined by local assessors to be the total taxable value of land and additions on the property. | Land | Improvement |
|---|---|---|---|---|
| 2024 | $11,622 | $137,988 | $23,890 | $114,098 |
| 2023 | $12,406 | $124,380 | $21,534 | $102,846 |
| 2022 | $12,406 | $131,224 | $18,826 | $112,398 |
| 2021 | $11,226 | $125,959 | $18,071 | $107,888 |
| 2020 | $10,865 | $122,863 | $17,627 | $105,236 |
| 2019 | $10,554 | $119,296 | $17,115 | $102,181 |
| 2018 | $10,999 | $125,573 | $19,236 | $106,337 |
| 2017 | $10,882 | $121,975 | $18,685 | $103,290 |
| 2016 | $10,799 | $116,544 | $17,853 | $98,691 |
| 2015 | $10,528 | $110,531 | $16,932 | $93,599 |
| 2014 | $10,989 | $115,888 | $16,689 | $99,199 |
| 2012 | $10,409 | $116,776 | $16,817 | $99,959 |
Source: Public Records
Map
Nearby Homes
- 387 Long Hill Rd
- 450 Tanglewood Dr
- 4437-4495 W Kennedy Dr
- 287 Kensington Ct Unit 4
- 134 Heritage Ct Unit B
- 4520 W Lawn Ave
- 4149 Oglesby Ave
- 4447 W Lawn Ave
- 4481 W Tucker Ln
- 1102 S Oplaine Rd
- 4390 W Parkway Ave
- 33564 Greenleaf St
- 0 Northwoods Ave Unit MRD11938775
- 640 Sanders Ct
- 1254 S Candlestick Way
- 1251 S Pleasant Hill Gate Unit 21
- 6091 Washington St
- 3810 1st St
- 705 Colby Ct Unit U78
- 598 Dunham Rd Unit U297
- 4775 Middle Rd
- 4799 Middle Rd
- 4763 Middle Rd Unit 1
- 4811 Middle Rd
- 4817 Kings Way W
- 474 Calvin Ct
- 486 Calvin Ct
- 4790 Middle Rd
- 4823 Kings Way W
- 4751 Middle Rd Unit 1
- 4802 Middle Rd
- 4778 Middle Rd
- 4766 Middle Rd
- 4814 Middle Rd
- 479 Calvin Ct
- 4739 Middle Rd
- 4754 Middle Rd
- 4812 Kings Way W Unit 4
- 4835 Kings Way W
- 4818 Kings Way W
Your Personal Tour Guide
Ask me questions while you tour the home.