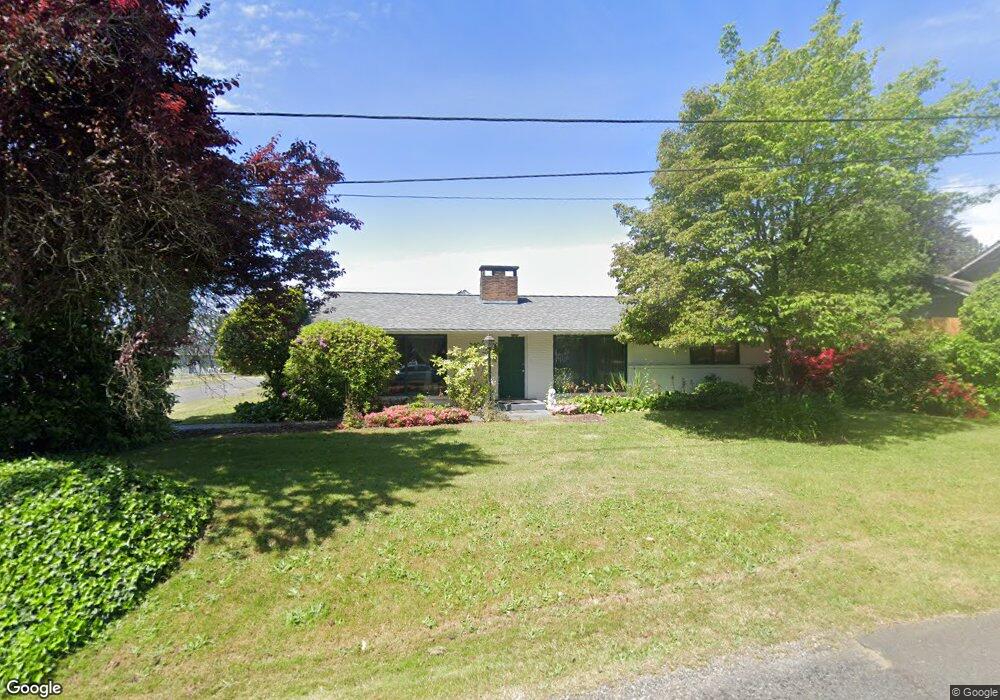
479 12th St Blaine, WA 98230
Estimated Value: $494,000 - $564,000
4
Beds
3
Baths
1,872
Sq Ft
$286/Sq Ft
Est. Value
About This Home
This home is located at 479 12th St, Blaine, WA 98230 and is currently estimated at $534,748, approximately $285 per square foot. 479 12th St is a home located in Whatcom County with nearby schools including Blaine Primary School, Blaine Elementary School, and Blaine Middle School.
Ownership History
Date
Name
Owned For
Owner Type
Purchase Details
Closed on
Apr 18, 2024
Sold by
Young Jayne N and Young Jane N
Bought by
Young Jane N
Current Estimated Value
Home Financials for this Owner
Home Financials are based on the most recent Mortgage that was taken out on this home.
Original Mortgage
$226,300
Interest Rate
6.74%
Mortgage Type
New Conventional
Purchase Details
Closed on
May 16, 2000
Sold by
Moore Derek M and Moore Pamela A
Bought by
Young Alonzo and Young Jayne N
Home Financials for this Owner
Home Financials are based on the most recent Mortgage that was taken out on this home.
Original Mortgage
$124,338
Interest Rate
8.22%
Mortgage Type
FHA
Create a Home Valuation Report for This Property
The Home Valuation Report is an in-depth analysis detailing your home's value as well as a comparison with similar homes in the area
Purchase History
| Date | Buyer | Sale Price | Title Company |
|---|---|---|---|
| Young Jane N | $313 | None Listed On Document | |
| Young Alonzo | $126,000 | Chicago Title Insurance Co |
Source: Public Records
Mortgage History
| Date | Status | Borrower | Loan Amount |
|---|---|---|---|
| Previous Owner | Young Jane N | $226,300 | |
| Previous Owner | Young Alonzo | $124,338 |
Source: Public Records
Tax History
| Year | Tax Paid | Tax Assessment Tax Assessment Total Assessment is a certain percentage of the fair market value that is determined by local assessors to be the total taxable value of land and additions on the property. | Land | Improvement |
|---|---|---|---|---|
| 2025 | $3,075 | $456,031 | $145,743 | $310,288 |
| 2024 | $3,041 | $451,516 | $144,300 | $307,216 |
| 2023 | $3,041 | $451,516 | $144,300 | $307,216 |
| 2022 | $2,860 | $406,771 | $130,000 | $276,771 |
| 2021 | $2,728 | $327,704 | $99,084 | $228,620 |
| 2020 | $2,595 | $284,960 | $86,160 | $198,800 |
| 2019 | $2,417 | $260,949 | $78,900 | $182,049 |
| 2018 | $2,246 | $237,136 | $71,700 | $165,436 |
| 2017 | $2,003 | $198,440 | $60,000 | $138,440 |
| 2016 | $2,069 | $198,440 | $60,000 | $138,440 |
| 2015 | $2,028 | $197,840 | $49,181 | $148,659 |
| 2014 | -- | $189,328 | $47,065 | $142,263 |
| 2013 | -- | $187,263 | $46,550 | $140,713 |
Source: Public Records
Map
Nearby Homes
Your Personal Tour Guide
Ask me questions while you tour the home.