
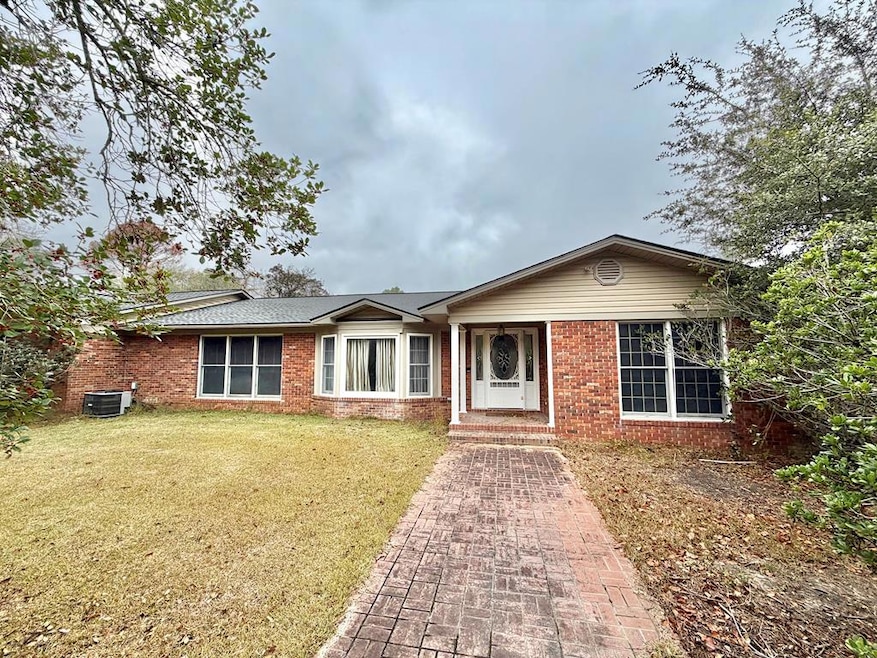
479 Altamaha Rd Hazlehurst, GA 31539
Estimated payment $4,668/month
4
Beds
3.5
Baths
3,975
Sq Ft
$195
Price per Sq Ft
Highlights
- Access To Pond
- In Ground Pool
- Sauna
- Greenhouse
- Home fronts a pond
- Pond View
About This Home
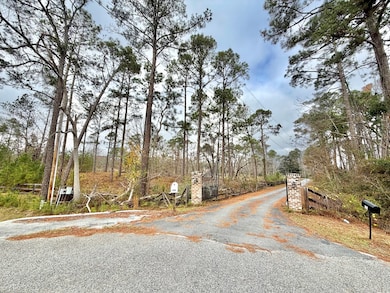
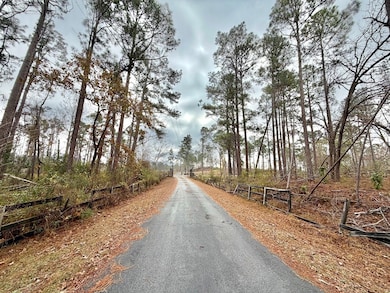
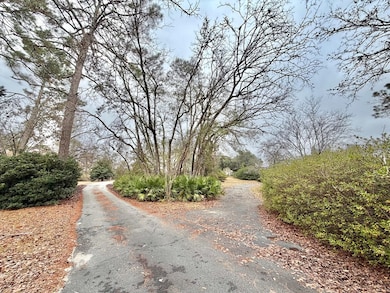
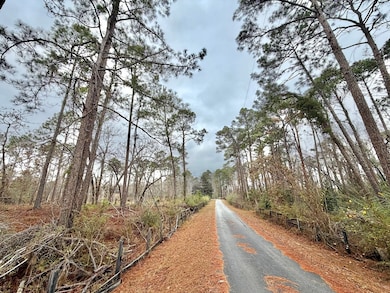
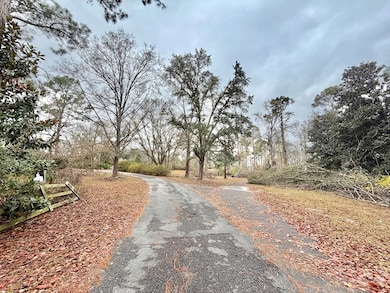
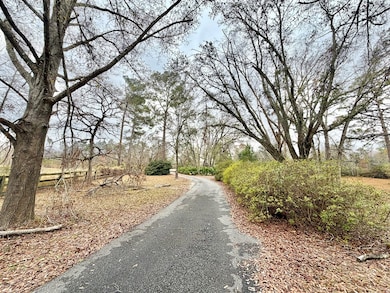
This unique 72-acre ranch is perfectly suited for rancher or anyone seeking privacy, space, and the freedom to chase their dreams. The property offers a custom-built brick home with 4 BR and 3.5 BA, 3975 sf. An office (or opt bedroom 5) has closet. Outdoor living area with an outdoor kitchen featuring a gas cooktop and a grill, inground gunite pool (needs repair) sauna, steam room, and hot tub. This area is perfect for entertaining or enjoying peaceful evenings at home. The property includes a stocked pond, a pole barn, several outbuildings, greenhouse (needs repair)and a workshop. The 8-stall horse barn offers a 2/1 apartment upstairs, a large hay loft, a tack room with interior stairs to the apartment. Other amenities include a wash area with a drain to septic, dog kennels with water lines and their own septic system. To top it all off, a hanger previously used for a helicopter; adding another feature to this one-of-a-kind property. Property offer as-is.
Listing Agent
Bateman Realty LLC Brokerage Phone: 9123799246 License #343539 Listed on: 12/08/2025
Property Details
Property Type
- Other
Est. Annual Taxes
- $7,098
Year Built
- Built in 1970
Lot Details
- 72.54 Acre Lot
- Home fronts a pond
- Fenced
- Front and Back Yard Sprinklers
- Wooded Lot
Home Design
- Traditional Architecture
- Farm
- Brick or Stone Mason
- Slab Foundation
Interior Spaces
- 3,975 Sq Ft Home
- 1-Story Property
- Wet Bar
- Bookcases
- Ceiling Fan
- Fireplace Features Masonry
- Double Pane Windows
- Entrance Foyer
- Family Room with Fireplace
- Great Room with Fireplace
- Combination Kitchen and Dining Room
- Home Office
- Utility Room
- Laundry Room
- Sauna
- Pond Views
Kitchen
- Eat-In Kitchen
- Oven
- Cooktop with Range Hood
- Microwave
- Dishwasher
- Kitchen Island
- Disposal
Flooring
- Wood
- Carpet
- Tile
Bedrooms and Bathrooms
- 4 Bedrooms
- Separate Shower
Parking
- 2 Parking Spaces
- Carport
- Parking Pad
- Parking Available
- Open Parking
Pool
- In Ground Pool
- Spa
Outdoor Features
- Access To Pond
- Deck
- Open Patio
- Greenhouse
- Separate Outdoor Workshop
- Outdoor Storage
- Outbuilding
Additional Homes
- Accessory Dwelling Unit (ADU)
Utilities
- Multiple cooling system units
- Central Heating and Cooling System
- Multiple Heating Units
- Well
- Water Heater
- Septic System
Community Details
- Community Storage Space
Listing and Financial Details
- Assessor Parcel Number 0071 001/0071 001B
Map
Create a Home Valuation Report for This Property
The Home Valuation Report is an in-depth analysis detailing your home's value as well as a comparison with similar homes in the area
Home Values in the Area
Average Home Value in this Area
Tax History
| Year | Tax Paid | Tax Assessment Tax Assessment Total Assessment is a certain percentage of the fair market value that is determined by local assessors to be the total taxable value of land and additions on the property. | Land | Improvement |
|---|---|---|---|---|
| 2024 | $6,893 | $234,624 | $54,600 | $180,024 |
| 2023 | $4,508 | $153,439 | $26,946 | $126,493 |
| 2022 | $4,508 | $153,439 | $26,946 | $126,493 |
| 2021 | $4,779 | $162,647 | $26,946 | $135,701 |
| 2020 | $4,779 | $162,647 | $26,946 | $135,701 |
| 2019 | $4,779 | $162,647 | $26,946 | $135,701 |
| 2017 | $4,094 | $155,289 | $26,946 | $128,343 |
| 2016 | $4,035 | $171,010 | $42,667 | $128,343 |
| 2015 | -- | $162,543 | $42,667 | $119,876 |
| 2014 | -- | $157,538 | $34,834 | $122,704 |
Source: Public Records
Property History
| Date | Event | Price | List to Sale | Price per Sq Ft |
|---|---|---|---|---|
| 12/08/2025 12/08/25 | For Sale | $775,000 | -- | $195 / Sq Ft |
Source: Altamaha Basin Board of REALTORS®
Purchase History
| Date | Type | Sale Price | Title Company |
|---|---|---|---|
| Warranty Deed | -- | -- | |
| Warranty Deed | -- | -- | |
| Warranty Deed | $35,000 | -- | |
| Interfamily Deed Transfer | -- | -- | |
| Deed | $550,000 | -- | |
| Deed | $1,000 | -- | |
| Deed | -- | -- | |
| Deed | $20,000 | -- |
Source: Public Records
About the Listing Agent
I’ve been a Realtor since 2010, and throughout that time I’ve had the pleasure of working with so many wonderful buyers and sellers. Each one has contributed to shaping my career. I am grateful and thankful to each of you that has made this dream a reality.
Victoria's Other Listings
-
$250,000 Pending
- 3 Beds
- 2 Baths
- 1,680 Sq Ft
- 13 Chestnut Rd
- Hazlehurst, GA
This one-owner home is tucked away in the Altamaha area and sits on 15.86 acres with a pond, grape vines, and blueberry bushes-plenty of room to roam and enjoy the outdoors! The home has 3 bedrooms and 2 bathrooms with 1,680 sq ft of living space, plus a 720 sq ft addition that includes a screened-in porch and a large laundry/storage room. The cozy family room has a fireplace for those cool
Victoria Bateman Bateman Realty
-
$127,500
- 2 Beds
- 2 Baths
- 1,338 Sq Ft
- 104 N Tallahassee St
- Hazlehurst, GA
This charming home is sure to catch your eye! Situated on a .34-acre corner lot, just minutes from the heart of town. This cozy 1,338 sq ft home features 2 bedrooms and 2 full baths, with an additional flexible room that can serve as a home office or potential 3rd bedroom (no closet). The original hardwood floors throughout most of the home remain in great condition, truly a reminder of the
Victoria Bateman Bateman Realty
-
$195,000
- 3 Beds
- 1 Bath
- 1,470 Sq Ft
- 20 W Sycamore St
- Hazlehurst, GA
Here's a rare chance to owntwo homes on a corner lot, and it even comes with a cool bit of history..this property was once owned byTy Cobb, the famous baseball legend known as the"Georgia Peach". He won the Triple Crown way back in1909! Themain househas 1470 sq ft offers 1 bedroom, 2 opt'l bedrooms (no closets), 1 full bath, a very charming sunroom located off from the kitchen. The charm
Victoria Bateman Bateman Realty
-
$347,500
- 3 Beds
- 3 Baths
- 2,247 Sq Ft
- 77 Jimmy Boatright Dr
- Hazlehurst, GA
Welcome to this charming rustic cedar-sided home, nestled on 7.17 acres just outside Hazlehurst. With 2,247 sf of living space, this home is full of character; featuring a wood accent wall and a corner Buck-style stove fireplace. The home offers 3 BR and 3 BA, including a primary BR with some handicap-accessible features. A sunroom or office is located just off the den, while the open kitchen and
Victoria Bateman Bateman Realty
Source: Altamaha Basin Board of REALTORS®
MLS Number: 23858
APN: 0071-001
Nearby Homes
- 99 Joe Hester Rd
- 3 Chestnut Rd
- 13 Chestnut Rd
- 0 Old Graham Rd Unit 10649506
- 0 Old Graham Rd Unit 23843
- 000 Old Graham Rd
- 00 Old Graham Rd
- 0 Old Graham Rd Unit 10531283
- 60 Ja Yawn Rd
- 152 Owl Head Trail
- 28 Jackson Hill Rd
- 15 Jackson Hill Rd
- 142 N Tallahassee St
- 95 E Plum St
- 104 N Tallahassee St
- 00 N Tallahassee St
- 39 N Tallahassee St
- 10 W 1st Ave
- 19 Martin Luther King jr Blvd
- 0 Walter Phillips Rd