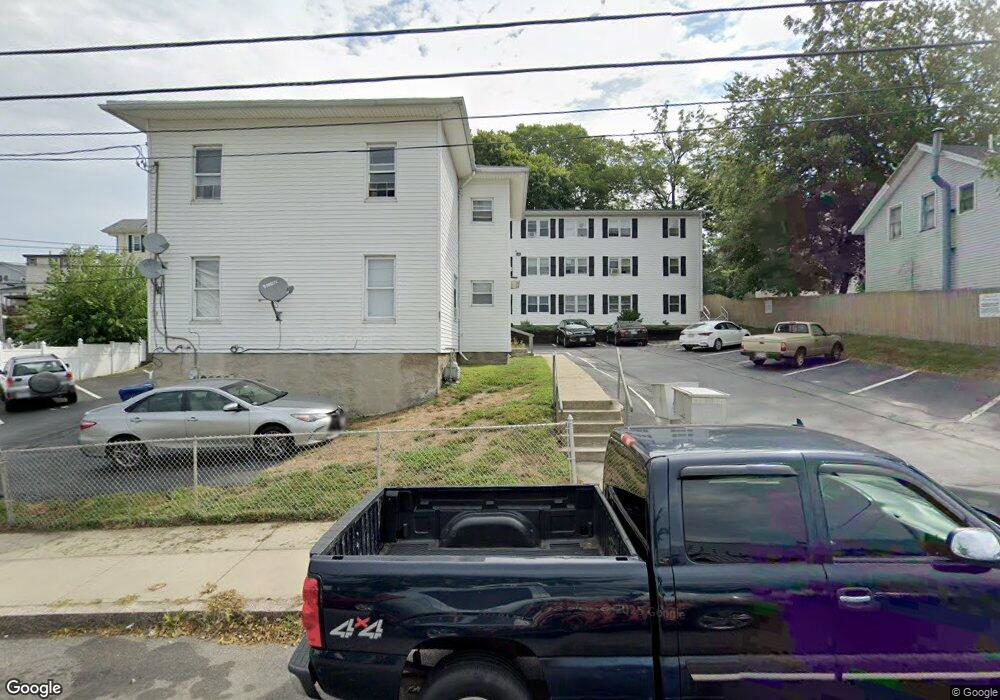
479 Durfee St Unit 3 Fall River, MA 02720
Lower Highlands NeighborhoodEstimated Value: $217,000 - $362,000
2
Beds
1
Bath
745
Sq Ft
$349/Sq Ft
Est. Value
About This Home
This home is located at 479 Durfee St Unit 3, Fall River, MA 02720 and is currently estimated at $259,992, approximately $348 per square foot. 479 Durfee St Unit 3 is a home located in Bristol County with nearby schools including Mary Fonseca Elementary School, Morton Middle School, and B M C Durfee High School.
Ownership History
Date
Name
Owned For
Owner Type
Purchase Details
Closed on
Jan 28, 2013
Sold by
Decoste Elizabeth
Bought by
Decoste Robert and Decoste Elizabeth
Current Estimated Value
Purchase Details
Closed on
Jun 30, 2008
Sold by
Wm Specialty Mortgage
Bought by
Decoste Elizabeth and Decoste Robert
Purchase Details
Closed on
Feb 28, 2007
Sold by
Overlock Maria T
Bought by
Wm Specialty Mtg Llc
Purchase Details
Closed on
Jan 22, 1997
Sold by
Lindo Manny
Bought by
Overlock Calvin N
Home Financials for this Owner
Home Financials are based on the most recent Mortgage that was taken out on this home.
Original Mortgage
$39,000
Interest Rate
7.5%
Mortgage Type
Purchase Money Mortgage
Purchase Details
Closed on
Jul 17, 1996
Sold by
Red Corp
Bought by
Lindo Manny
Purchase Details
Closed on
Dec 19, 1994
Sold by
Cosenza David W
Bought by
Citicorp Mtg Inc
Purchase Details
Closed on
Mar 7, 1989
Sold by
Fall River Constr C
Bought by
Cosenza David W
Home Financials for this Owner
Home Financials are based on the most recent Mortgage that was taken out on this home.
Original Mortgage
$56,900
Interest Rate
10.63%
Mortgage Type
Purchase Money Mortgage
Create a Home Valuation Report for This Property
The Home Valuation Report is an in-depth analysis detailing your home's value as well as a comparison with similar homes in the area
Home Values in the Area
Average Home Value in this Area
Purchase History
| Date | Buyer | Sale Price | Title Company |
|---|---|---|---|
| Decoste Robert | -- | -- | |
| Decoste Elizabeth | $46,000 | -- | |
| Wm Specialty Mtg Llc | $80,868 | -- | |
| Overlock Calvin N | $39,500 | -- | |
| Lindo Manny | $22,000 | -- | |
| Citicorp Mtg Inc | $7,000 | -- | |
| Cosenza David W | $75,900 | -- |
Source: Public Records
Mortgage History
| Date | Status | Borrower | Loan Amount |
|---|---|---|---|
| Previous Owner | Cosenza David W | $39,000 | |
| Previous Owner | Cosenza David W | $56,900 |
Source: Public Records
Tax History
| Year | Tax Paid | Tax Assessment Tax Assessment Total Assessment is a certain percentage of the fair market value that is determined by local assessors to be the total taxable value of land and additions on the property. | Land | Improvement |
|---|---|---|---|---|
| 2025 | $2,100 | $183,400 | $0 | $183,400 |
| 2024 | $1,620 | $141,000 | $0 | $141,000 |
| 2023 | $1,574 | $128,300 | $0 | $128,300 |
| 2022 | $1,437 | $113,900 | $0 | $113,900 |
| 2021 | $1,303 | $94,200 | $0 | $94,200 |
| 2020 | $970 | $67,100 | $0 | $67,100 |
| 2019 | $943 | $64,700 | $0 | $64,700 |
| 2018 | $930 | $63,600 | $0 | $63,600 |
| 2017 | $890 | $63,600 | $0 | $63,600 |
| 2016 | $842 | $61,800 | $0 | $61,800 |
| 2015 | $903 | $69,000 | $0 | $69,000 |
| 2014 | $936 | $74,400 | $0 | $74,400 |
Source: Public Records
Map
Nearby Homes
- 339 Danforth St Unit 6
- 337 Danforth St Unit 7
- 575 N Main St
- 9 Doctor St
- 126 June St
- 450 Rock St Unit 1
- 206 Durfee St Unit 1A
- 206 Durfee St Unit 2B
- 206 Durfee St Unit 2A
- 206 Durfee St Unit 1B
- 360 High St
- 34 Danforth St
- 750 Davol St Unit 1012
- 750 Davol St Unit 219
- 750 Davol St Unit 221
- 750 Davol St Unit 616
- 750 Davol St Unit 214
- 499 Maple St
- 72 Belmont St
- 11 Dyer St
- 479 Durfee St
- 479 Durfee St Unit 17
- 479 Durfee St Unit 16
- 479 Durfee St Unit 15
- 479 Durfee St Unit 14
- 479 Durfee St Unit 13
- 479 Durfee St Unit 12
- 479 Durfee St Unit 11
- 479 Durfee St Unit 10
- 479 Durfee St Unit 9
- 479 Durfee St Unit 8
- 479 Durfee St Unit 7
- 479 Durfee St Unit 6
- 479 Durfee St Unit 5
- 479 Durfee St Unit 4
- 479 Durfee St Unit 2
- 479 Durfee St Unit 1
- 469 Durfee St
- 481 Durfee St
- 93-95 Cedar St
Your Personal Tour Guide
Ask me questions while you tour the home.