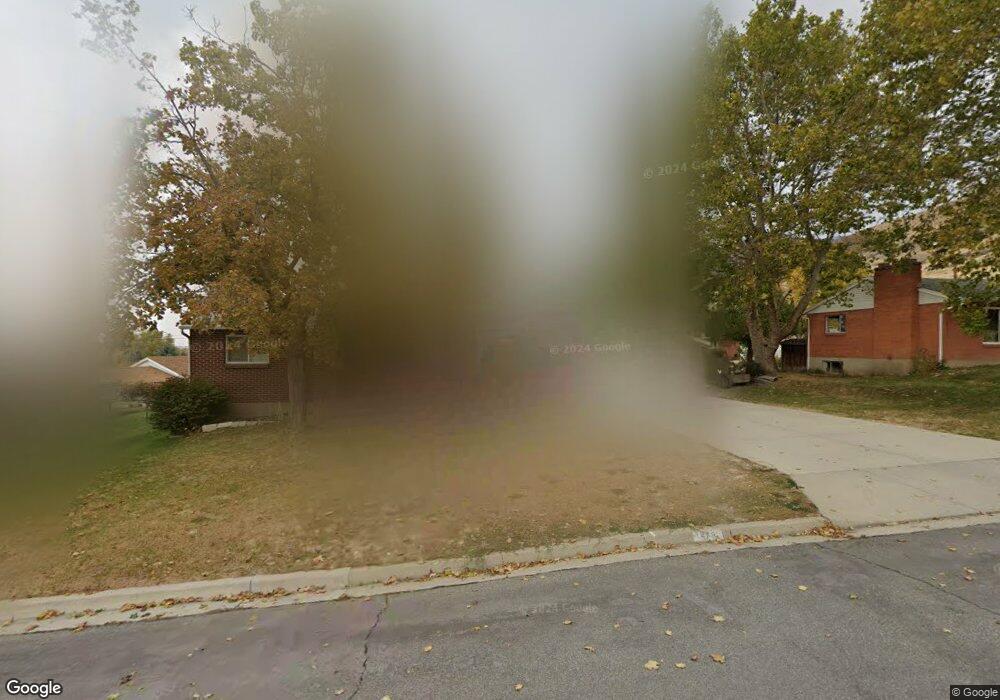
479 E 1000 N Bountiful, UT 84010
Estimated Value: $500,000 - $599,000
4
Beds
2
Baths
2,132
Sq Ft
$260/Sq Ft
Est. Value
About This Home
This home is located at 479 E 1000 N, Bountiful, UT 84010 and is currently estimated at $555,282, approximately $260 per square foot. 479 E 1000 N is a home located in Davis County with nearby schools including Tolman School, Bountiful Junior High School, and Viewmont High School.
Ownership History
Date
Name
Owned For
Owner Type
Purchase Details
Closed on
Mar 5, 2020
Sold by
Kent Michal L
Bought by
Wells Madison Ann and Wells Ryan
Current Estimated Value
Home Financials for this Owner
Home Financials are based on the most recent Mortgage that was taken out on this home.
Original Mortgage
$383,150
Outstanding Balance
$339,253
Interest Rate
3.6%
Mortgage Type
New Conventional
Estimated Equity
$216,030
Purchase Details
Closed on
Feb 19, 2019
Sold by
Rosenberg Gerda H and Garde H Rosenberg Trust
Bought by
Kent Michael L
Purchase Details
Closed on
Mar 14, 2006
Sold by
Rosenberg Gerda H
Bought by
Rosenberg Gerda H
Purchase Details
Closed on
Jun 4, 1998
Sold by
Harlacker Gerda H
Bought by
Rosenberg Gerda H
Purchase Details
Closed on
Dec 29, 1997
Sold by
Harlacker Currie A
Bought by
Harlacker Gerda H
Create a Home Valuation Report for This Property
The Home Valuation Report is an in-depth analysis detailing your home's value as well as a comparison with similar homes in the area
Purchase History
| Date | Buyer | Sale Price | Title Company |
|---|---|---|---|
| Wells Madison Ann | -- | Stewart Title Ins Age | |
| Kent Michael L | -- | Paramount Title Corp | |
| Rosenberg Gerda H | -- | None Available | |
| Rosenberg Gerda H | -- | -- | |
| Harlacker Gerda H | -- | -- |
Source: Public Records
Mortgage History
| Date | Status | Borrower | Loan Amount |
|---|---|---|---|
| Open | Wells Madison Ann | $383,150 |
Source: Public Records
Tax History
| Year | Tax Paid | Tax Assessment Tax Assessment Total Assessment is a certain percentage of the fair market value that is determined by local assessors to be the total taxable value of land and additions on the property. | Land | Improvement |
|---|---|---|---|---|
| 2025 | $3,017 | $273,900 | $127,529 | $146,371 |
| 2024 | $2,842 | $267,850 | $117,677 | $150,173 |
| 2023 | $2,953 | $482,000 | $212,120 | $269,880 |
| 2022 | $3,034 | $286,000 | $112,779 | $173,221 |
| 2021 | $2,760 | $398,000 | $167,515 | $230,485 |
| 2020 | $2,414 | $349,000 | $152,559 | $196,441 |
| 2019 | $2,057 | $287,000 | $153,074 | $133,926 |
| 2018 | $553 | $247,000 | $141,814 | $105,186 |
| 2016 | $533 | $116,216 | $43,863 | $72,353 |
| 2015 | $1,568 | $109,506 | $43,863 | $65,643 |
| 2014 | $1,581 | $113,991 | $43,863 | $70,128 |
| 2013 | -- | $99,281 | $43,945 | $55,336 |
Source: Public Records
Map
Nearby Homes
- 662 E 1200 N
- 610 E Pages Ln
- 975 E 1050 N
- 453 N 400 E Unit 7-D
- 1420 N Main St
- 345 N 400 E
- 1023 E 800 N
- 967 S Courtyard Ln
- 683 E 100 N
- 908 Northern Hills Dr Unit 3
- 1105 E 600 N
- 933 Northern Hills Cir
- 96 Village Square Rd
- 106 W 700 N
- 345 E 600 S
- 49 E 200 N Unit 4
- 41 E 200 N Unit 6
- 951 Centerville Commons Way
- 16 W 780 S
- 1260 N 200 W
Your Personal Tour Guide
Ask me questions while you tour the home.