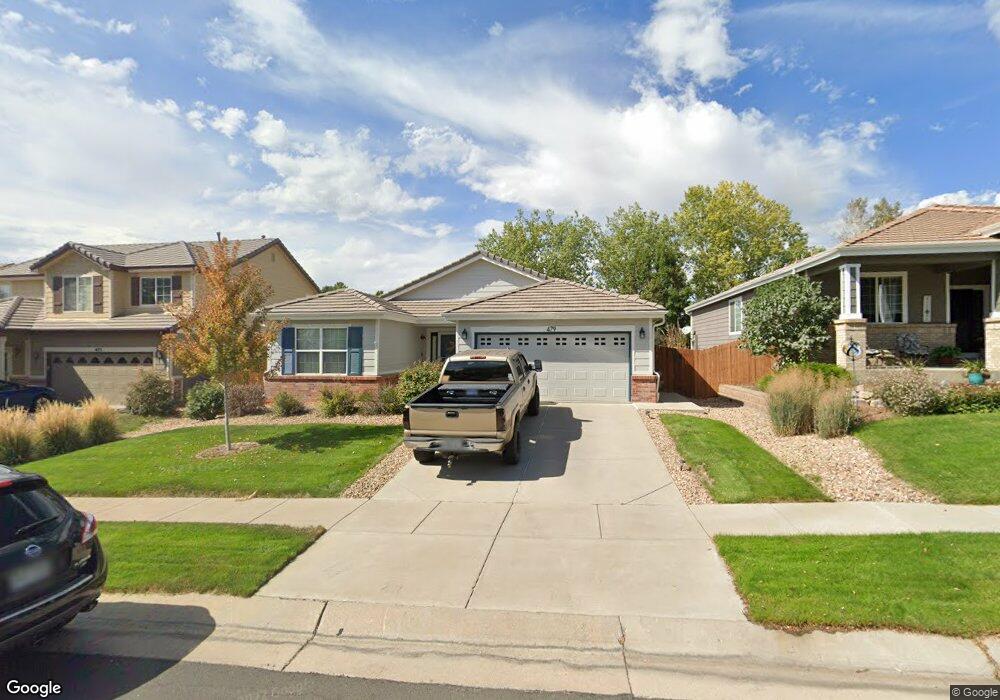
479 Hayloft Way Brighton, CO 80601
Estimated Value: $489,000 - $524,000
3
Beds
2
Baths
1,717
Sq Ft
$291/Sq Ft
Est. Value
About This Home
This home is located at 479 Hayloft Way, Brighton, CO 80601 and is currently estimated at $498,804, approximately $290 per square foot. 479 Hayloft Way is a home located in Adams County with nearby schools including Overland Trail Middle School, Brighton High School, and Bromley East Charter School.
Ownership History
Date
Name
Owned For
Owner Type
Purchase Details
Closed on
Oct 10, 2024
Sold by
Bolkey Taylor Starr and Lockhart Damian Josiah
Bought by
Lockhart Taylor S and Lockhart Damian J
Current Estimated Value
Purchase Details
Closed on
Jun 10, 2020
Sold by
Mitchell Ronald Kevin and Mitchell Kimberly Dawn
Bought by
Bolkey Taylor Starr and Lockhart Damian Josiah
Home Financials for this Owner
Home Financials are based on the most recent Mortgage that was taken out on this home.
Original Mortgage
$356,250
Interest Rate
3.2%
Mortgage Type
New Conventional
Purchase Details
Closed on
Dec 27, 2017
Sold by
Lepore Joyce A
Bought by
Mitchell Ronald Kevin and Mitchell Kimberly Dawn
Purchase Details
Closed on
Mar 31, 2009
Sold by
Richmond American Homes Of Colorado Inc
Bought by
Lepore Eugene and Lepore Joyce A
Home Financials for this Owner
Home Financials are based on the most recent Mortgage that was taken out on this home.
Original Mortgage
$112,000
Interest Rate
5.24%
Mortgage Type
Unknown
Create a Home Valuation Report for This Property
The Home Valuation Report is an in-depth analysis detailing your home's value as well as a comparison with similar homes in the area
Home Values in the Area
Average Home Value in this Area
Purchase History
| Date | Buyer | Sale Price | Title Company |
|---|---|---|---|
| Lockhart Taylor S | -- | Land Title | |
| Bolkey Taylor Starr | $375,000 | Land Title Guarantee Co | |
| Mitchell Ronald Kevin | $335,000 | Stewart Title | |
| Lepore Eugene | $190,000 | None Available |
Source: Public Records
Mortgage History
| Date | Status | Borrower | Loan Amount |
|---|---|---|---|
| Previous Owner | Bolkey Taylor Starr | $356,250 | |
| Previous Owner | Lepore Eugene | $112,000 |
Source: Public Records
Tax History Compared to Growth
Tax History
| Year | Tax Paid | Tax Assessment Tax Assessment Total Assessment is a certain percentage of the fair market value that is determined by local assessors to be the total taxable value of land and additions on the property. | Land | Improvement |
|---|---|---|---|---|
| 2024 | $5,456 | $31,500 | $7,190 | $24,310 |
| 2023 | $5,451 | $36,670 | $7,780 | $28,890 |
| 2022 | $4,505 | $27,260 | $6,320 | $20,940 |
| 2021 | $4,505 | $27,260 | $6,320 | $20,940 |
| 2020 | $4,236 | $25,740 | $6,510 | $19,230 |
| 2019 | $4,458 | $25,740 | $6,510 | $19,230 |
| 2018 | $3,930 | $21,080 | $6,840 | $14,240 |
| 2017 | $3,933 | $21,080 | $6,840 | $14,240 |
| 2016 | $3,353 | $17,920 | $3,900 | $14,020 |
| 2015 | $3,341 | $17,920 | $3,900 | $14,020 |
| 2014 | -- | $15,850 | $3,340 | $12,510 |
Source: Public Records
Map
Nearby Homes
- 445 Tumbleweed Dr
- 4250 Combine Place
- 608 Hayloft Way
- 215 Blue Bonnet Dr Unit 9C
- 256 Homestead Way
- 4545 Oxbow Dr
- 207 Harrow Ct
- 3978 Balderas St
- 4479 Boone Cir
- 156 Chapel Hill Cir
- 3938 Balderas St
- 4455 Boone Cir
- 4436 Windmill Dr
- 4439 Boone Cir
- 258 N 45th Ave
- 147 Chapel Hill Cir
- 4645 Longs Peak St
- 4649 Spinning Wheel Dr
- 267 Wooten Ave
- 118 Foxglove Dr Unit 23D
- 475 Hayloft Way
- 480 Hayloft Way
- 476 Hayloft Way
- 469 Hayloft Way
- 482 Hayloft Way
- 470 Hayloft Way
- 495 Hayloft Way
- 498 Hayloft Way
- 457 Hayloft Way
- 460 Hayloft Way
- 483 Stetson Ct
- 473 Stetson Ct
- 487 Stetson Ct
- 463 Stetson Ct
- 456 Hayloft Way
- 455 Hayloft Way
- 447 Hayloft Way
- 493 Stetson Ct
- 453 Stetson Ct
- 443 Stetson Ct