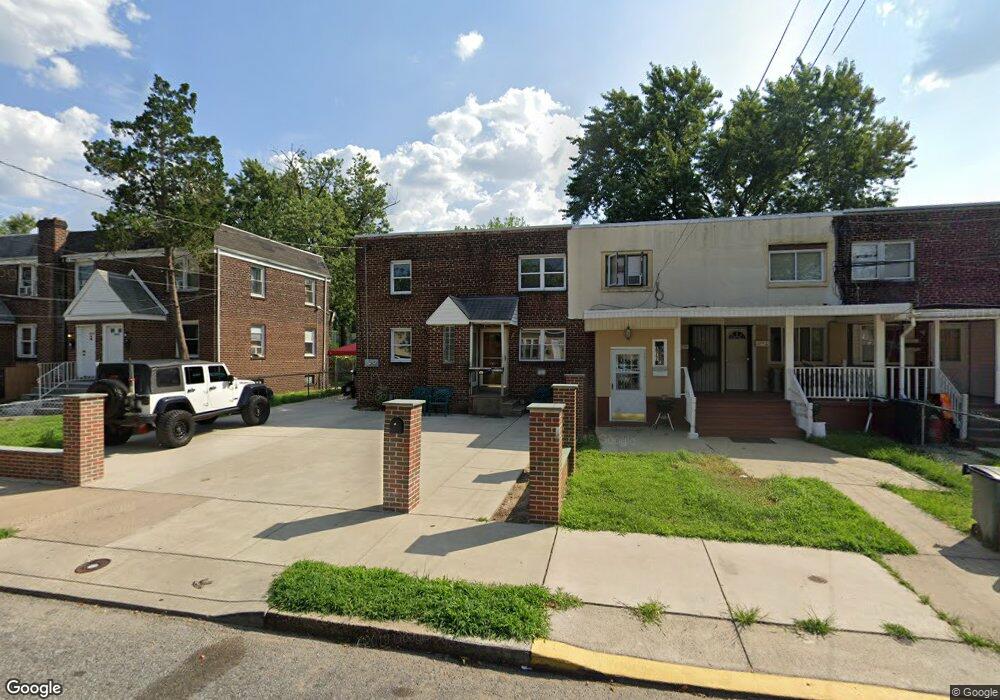
479 Rand St Camden, NJ 08105
Marlton NeighborhoodEstimated Value: $156,435 - $202,000
--
Bed
--
Bath
1,352
Sq Ft
$134/Sq Ft
Est. Value
About This Home
This home is located at 479 Rand St, Camden, NJ 08105 and is currently estimated at $180,859, approximately $133 per square foot. 479 Rand St is a home located in Camden County with nearby schools including Alfred Cramer College Preparatory Lab School, Eastside High School, and St Joseph Pro-Cathedral School.
Ownership History
Date
Name
Owned For
Owner Type
Purchase Details
Closed on
Jun 21, 2001
Sold by
Camacho Luz M
Bought by
Mercado Angel M
Current Estimated Value
Purchase Details
Closed on
Aug 11, 2000
Sold by
Mumford Vincent
Bought by
Camacho Luz M
Home Financials for this Owner
Home Financials are based on the most recent Mortgage that was taken out on this home.
Original Mortgage
$44,938
Interest Rate
8.13%
Purchase Details
Closed on
Feb 4, 2000
Sold by
Federal Housing Administration
Bought by
Mumford Vincent
Create a Home Valuation Report for This Property
The Home Valuation Report is an in-depth analysis detailing your home's value as well as a comparison with similar homes in the area
Home Values in the Area
Average Home Value in this Area
Purchase History
| Date | Buyer | Sale Price | Title Company |
|---|---|---|---|
| Mercado Angel M | $50,000 | -- | |
| Mercado Angel M | $50,000 | -- | |
| Camacho Luz M | $44,900 | -- | |
| Mumford Vincent | $15,808 | -- |
Source: Public Records
Mortgage History
| Date | Status | Borrower | Loan Amount |
|---|---|---|---|
| Previous Owner | Camacho Luz M | $44,938 |
Source: Public Records
Tax History Compared to Growth
Tax History
| Year | Tax Paid | Tax Assessment Tax Assessment Total Assessment is a certain percentage of the fair market value that is determined by local assessors to be the total taxable value of land and additions on the property. | Land | Improvement |
|---|---|---|---|---|
| 2025 | $3,079 | $86,900 | $22,000 | $64,900 |
| 2024 | $2,976 | $86,900 | $22,000 | $64,900 |
| 2023 | $2,976 | $86,900 | $22,000 | $64,900 |
| 2022 | $2,921 | $86,900 | $22,000 | $64,900 |
| 2021 | $2,910 | $86,900 | $22,000 | $64,900 |
| 2020 | $2,763 | $86,900 | $22,000 | $64,900 |
| 2019 | $2,646 | $86,900 | $22,000 | $64,900 |
| 2018 | $2,632 | $86,900 | $22,000 | $64,900 |
| 2017 | $2,568 | $86,900 | $22,000 | $64,900 |
| 2016 | $2,486 | $86,900 | $22,000 | $64,900 |
| 2015 | $2,393 | $86,900 | $22,000 | $64,900 |
| 2014 | $2,336 | $86,900 | $22,000 | $64,900 |
Source: Public Records
Map
Nearby Homes
- 477 Rand St
- 420 Boyd St
- 506 Pfeiffer St
- 444 Pfeiffer St
- 608 Raritan St
- 341 Marlton Ave
- 555 Pfeiffer St
- 603 Raritan St
- 7130 Rosemont Ave
- 355 S 27th St
- 154 Eutaw Ave
- 7186 Waldorf Ave
- 2598 Baird Blvd
- 2933 Royden St
- 6861 Clark Ave
- 402 S 30th St
- 3001 Royden St
- 520 Beacon Ave
- 363 Garden Ave
- 2621 Westfield Ave