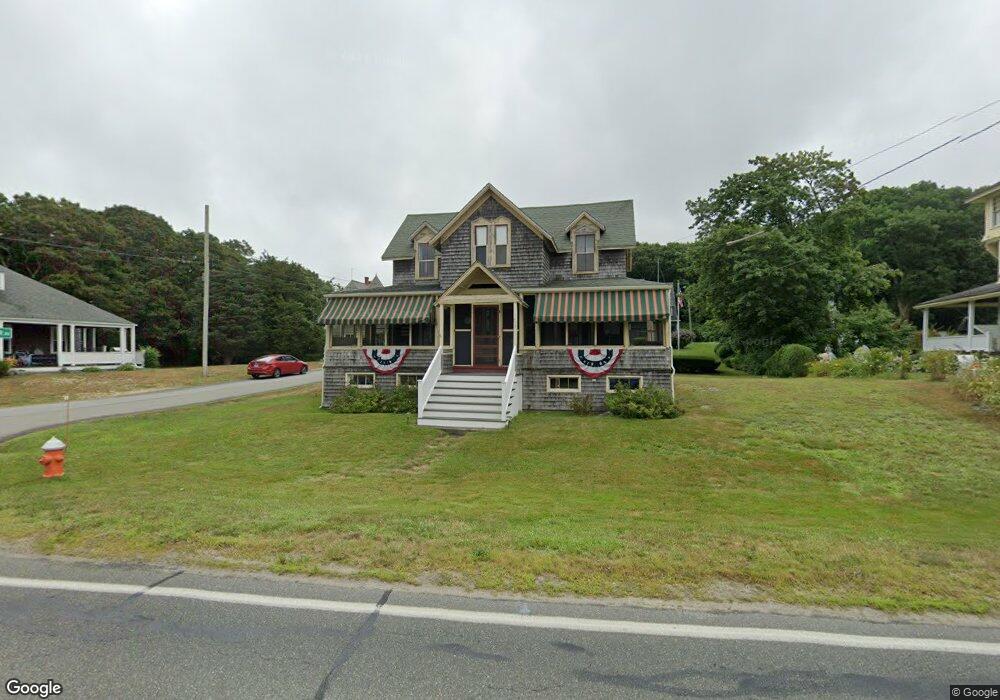
479 Shore Rd Pocasset, MA 02559
Monument Beach NeighborhoodEstimated Value: $601,747 - $898,000
5
Beds
3
Baths
1,688
Sq Ft
$403/Sq Ft
Est. Value
About This Home
This home is located at 479 Shore Rd, Pocasset, MA 02559 and is currently estimated at $679,437, approximately $402 per square foot. 479 Shore Rd is a home located in Barnstable County with nearby schools including Bourne High School, St Margaret Regional School, and Cadence Academy Preschool - Bourne.
Ownership History
Date
Name
Owned For
Owner Type
Purchase Details
Closed on
Jun 18, 2020
Sold by
Virginia A Lambert Ret and Lambert
Bought by
Lambert Neil A and Lambert John R
Current Estimated Value
Purchase Details
Closed on
Aug 28, 2019
Sold by
Lambert Virginia A
Bought by
Virginia A Lambert Ret and Lambert
Create a Home Valuation Report for This Property
The Home Valuation Report is an in-depth analysis detailing your home's value as well as a comparison with similar homes in the area
Home Values in the Area
Average Home Value in this Area
Purchase History
| Date | Buyer | Sale Price | Title Company |
|---|---|---|---|
| Lambert Neil A | -- | None Available | |
| Lambert Neil A | -- | None Available | |
| Virginia A Lambert Ret | -- | -- | |
| Virginia A Lambert Ret | -- | -- |
Source: Public Records
Tax History
| Year | Tax Paid | Tax Assessment Tax Assessment Total Assessment is a certain percentage of the fair market value that is determined by local assessors to be the total taxable value of land and additions on the property. | Land | Improvement |
|---|---|---|---|---|
| 2025 | $4,206 | $538,500 | $217,700 | $320,800 |
| 2024 | $4,113 | $512,800 | $207,300 | $305,500 |
| 2023 | $3,998 | $453,800 | $183,500 | $270,300 |
| 2022 | $3,934 | $389,900 | $175,400 | $214,500 |
| 2021 | $3,822 | $354,900 | $159,600 | $195,300 |
| 2020 | $3,804 | $354,200 | $158,100 | $196,100 |
| 2019 | $3,607 | $343,200 | $158,100 | $185,100 |
| 2018 | $3,447 | $327,000 | $150,600 | $176,400 |
| 2017 | $3,277 | $318,200 | $143,600 | $174,600 |
| 2016 | $2,927 | $288,100 | $143,600 | $144,500 |
| 2015 | $2,901 | $288,100 | $143,600 | $144,500 |
Source: Public Records
Map
Nearby Homes
- 566 Shore Rd
- 10 Howard Ave
- 10 Howard Ave
- 203 County Rd
- 14 Navajo Rd
- 35 Benedict Rd
- 16 Amberwood Ct
- 20 Colony Ave
- 5 Harbor Hill Dr
- 4 Harbor Hill Dr
- 12 Turnberry Rd Unit 12
- 13 Laurel Hill Ct
- 2 Applewood Ct
- 709 County Rd
- 5 Sea Knoll Ct
- 254 Barlows Landing Rd
- 5 Zoli Ln
- 4 Hollyhock Knoll Ct Unit 4
- 4 Hollyhock Knoll Ct Unit 4
- 3 1st St
Your Personal Tour Guide
Ask me questions while you tour the home.