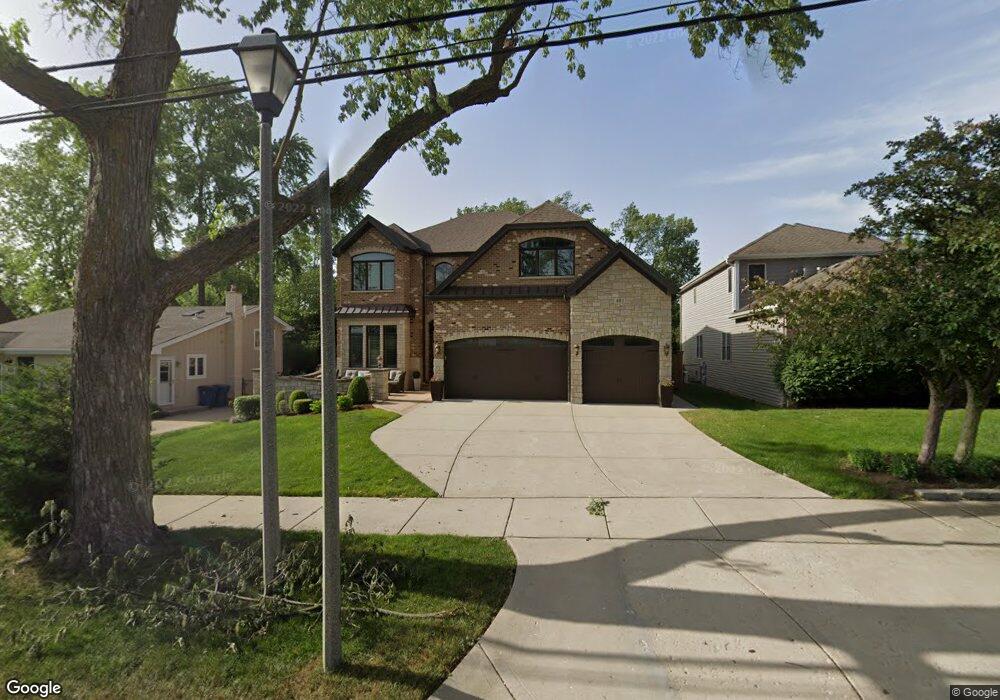
479 W 2nd St Elmhurst, IL 60126
Estimated Value: $1,326,000 - $1,609,000
--
Bed
--
Bath
3,995
Sq Ft
$368/Sq Ft
Est. Value
About This Home
This home is located at 479 W 2nd St, Elmhurst, IL 60126 and is currently estimated at $1,468,962, approximately $367 per square foot. 479 W 2nd St is a home located in DuPage County with nearby schools including Reinberg Elementary School, Ruggles Elementary School, and Hawthorne Elementary School.
Ownership History
Date
Name
Owned For
Owner Type
Purchase Details
Closed on
Apr 19, 2018
Sold by
Rogas Robert F and Rogas Nicole R
Bought by
Rogas Nicole R
Current Estimated Value
Purchase Details
Closed on
Jan 16, 2015
Sold by
Hillview Custom Homes Inc
Bought by
Rogas Robert F and Rogas Nicole R
Home Financials for this Owner
Home Financials are based on the most recent Mortgage that was taken out on this home.
Original Mortgage
$315,000
Outstanding Balance
$242,164
Interest Rate
3.94%
Mortgage Type
Purchase Money Mortgage
Estimated Equity
$1,226,798
Purchase Details
Closed on
Jan 24, 2013
Sold by
Oxford Bank & Trust
Bought by
Hillview Custom Homes Inc
Purchase Details
Closed on
Jul 19, 2004
Sold by
Conneely Builders Inc
Bought by
Oxford Bank & Trust and Trust #1204
Create a Home Valuation Report for This Property
The Home Valuation Report is an in-depth analysis detailing your home's value as well as a comparison with similar homes in the area
Home Values in the Area
Average Home Value in this Area
Purchase History
| Date | Buyer | Sale Price | Title Company |
|---|---|---|---|
| Rogas Nicole R | -- | Attorney | |
| Rogas Robert F | $915,000 | Git | |
| Hillview Custom Homes Inc | $240,000 | Fidelity National Title | |
| Oxford Bank & Trust | $350,000 | Multiple |
Source: Public Records
Mortgage History
| Date | Status | Borrower | Loan Amount |
|---|---|---|---|
| Open | Rogas Robert F | $315,000 |
Source: Public Records
Tax History Compared to Growth
Tax History
| Year | Tax Paid | Tax Assessment Tax Assessment Total Assessment is a certain percentage of the fair market value that is determined by local assessors to be the total taxable value of land and additions on the property. | Land | Improvement |
|---|---|---|---|---|
| 2024 | $24,795 | $419,432 | $116,683 | $302,749 |
| 2023 | $23,061 | $387,860 | $107,900 | $279,960 |
| 2022 | $23,041 | $385,980 | $103,720 | $282,260 |
| 2021 | $22,482 | $376,380 | $101,140 | $275,240 |
| 2020 | $21,622 | $368,130 | $98,920 | $269,210 |
| 2019 | $21,189 | $350,000 | $94,050 | $255,950 |
| 2018 | $23,845 | $390,900 | $89,040 | $301,860 |
| 2017 | $23,352 | $372,500 | $84,850 | $287,650 |
| 2016 | $22,895 | $350,910 | $79,930 | $270,980 |
| 2015 | $21,247 | $306,200 | $74,470 | $231,730 |
| 2014 | $4,554 | $59,100 | $59,100 | $0 |
| 2013 | $4,502 | $59,930 | $59,930 | $0 |
Source: Public Records
Map
Nearby Homes
- 285 N Ridgeland Ave
- 284 N Highland Ave
- 407 W North Ave
- 322 N Highland Ave
- 196 N Walnut St
- 355 W 1st St
- 120 N Walnut St
- 156 S Sunnyside Ave
- 170 S Fairview Ave
- 412 N Ridgeland Ave
- 104 Evergreen Ave
- 442 N Oak St
- 193 N Elm Ave
- 468 N Highland Ave
- 508 W Alma St
- 255 S West Ave Unit 214
- 255 S West Ave Unit 413
- 452 W Alma St
- 17W517 Manor Ln
- 210 N Addison Ave Unit 202