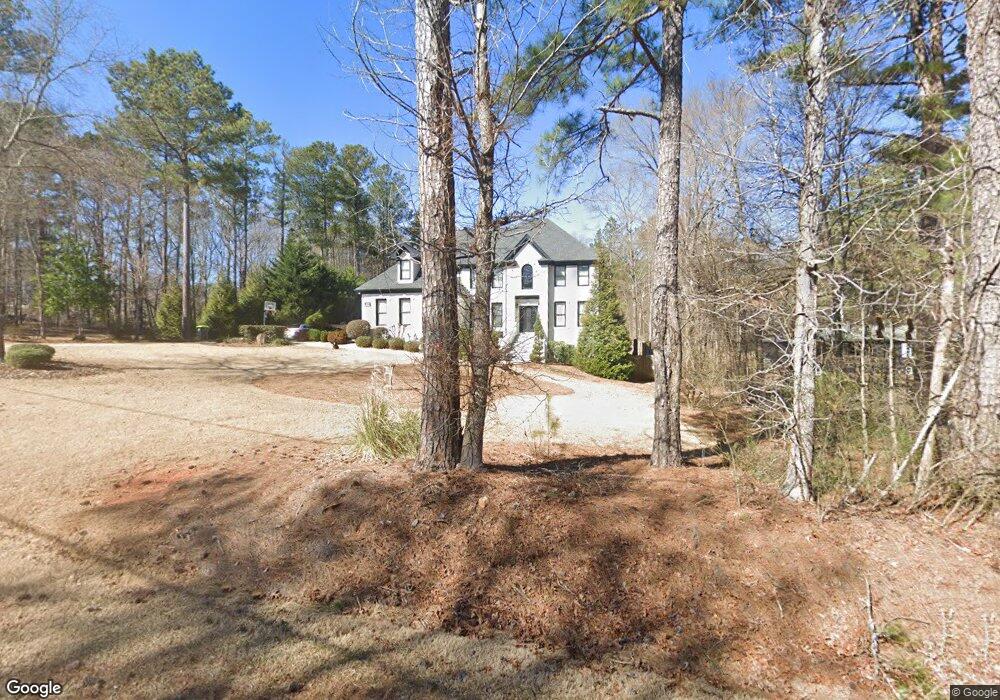
479 Ward Rd Ellenwood, GA 30294
Estimated Value: $474,000 - $653,000
4
Beds
4
Baths
3,138
Sq Ft
$183/Sq Ft
Est. Value
About This Home
This home is located at 479 Ward Rd, Ellenwood, GA 30294 and is currently estimated at $573,839, approximately $182 per square foot. 479 Ward Rd is a home located in Henry County with nearby schools including Austin Road Elementary School, Austin Road Middle School, and Woodland High School.
Ownership History
Date
Name
Owned For
Owner Type
Purchase Details
Closed on
Dec 30, 2008
Sold by
Ib Property Holdings Llc
Bought by
Miller Vincent and Miller Monica
Current Estimated Value
Home Financials for this Owner
Home Financials are based on the most recent Mortgage that was taken out on this home.
Original Mortgage
$261,449
Outstanding Balance
$171,225
Interest Rate
5.95%
Mortgage Type
FHA
Estimated Equity
$402,614
Purchase Details
Closed on
Aug 5, 2008
Sold by
Bayview Loan Servicing Llc
Bought by
Ib Property Holdings Llc
Purchase Details
Closed on
Apr 26, 2006
Sold by
Cumberbatch Vincent
Bought by
Palmer Eula
Home Financials for this Owner
Home Financials are based on the most recent Mortgage that was taken out on this home.
Original Mortgage
$312,000
Interest Rate
9.65%
Mortgage Type
New Conventional
Create a Home Valuation Report for This Property
The Home Valuation Report is an in-depth analysis detailing your home's value as well as a comparison with similar homes in the area
Home Values in the Area
Average Home Value in this Area
Purchase History
| Date | Buyer | Sale Price | Title Company |
|---|---|---|---|
| Miller Vincent | $264,900 | -- | |
| Ib Property Holdings Llc | -- | -- | |
| Bayview Loan Servicing Llc | -- | -- | |
| Palmer Eula | $390,000 | -- |
Source: Public Records
Mortgage History
| Date | Status | Borrower | Loan Amount |
|---|---|---|---|
| Open | Miller Vincent | $261,449 | |
| Previous Owner | Palmer Eula | $312,000 |
Source: Public Records
Tax History Compared to Growth
Tax History
| Year | Tax Paid | Tax Assessment Tax Assessment Total Assessment is a certain percentage of the fair market value that is determined by local assessors to be the total taxable value of land and additions on the property. | Land | Improvement |
|---|---|---|---|---|
| 2025 | $7,082 | $219,856 | $15,760 | $204,096 |
| 2024 | $7,082 | $210,720 | $14,560 | $196,160 |
| 2023 | $6,291 | $207,240 | $14,000 | $193,240 |
| 2022 | $5,458 | $150,600 | $12,960 | $137,640 |
| 2021 | $4,546 | $124,520 | $11,120 | $113,400 |
| 2020 | $4,019 | $110,800 | $10,480 | $100,320 |
| 2019 | $3,956 | $109,160 | $9,920 | $99,240 |
| 2018 | $3,689 | $102,200 | $9,160 | $93,040 |
| 2016 | $3,155 | $88,280 | $7,160 | $81,120 |
| 2015 | $3,276 | $89,120 | $7,240 | $81,880 |
| 2014 | $3,009 | $81,560 | $7,240 | $74,320 |
Source: Public Records
Map
Nearby Homes
- 460 Ward Rd
- 510 Ward Rd Unit 1
- 120 Bunnie Trail
- 19 Little Mountain Village
- 17 Little Mountain Village
- 5931 Brassie Ridge Ln
- 5992 Little Mountain Dr
- 4241 Hearn Rd
- 5520 Hearn Rd
- 116 Kalsum Trail
- 5833 Little Mountain Dr
- 6733 Highway 155 N
- 4665 River Hill Cir
- 4573 River Vista Rd
- 4676 Lake Vista Cir
- 4360 Riverstone Shoals