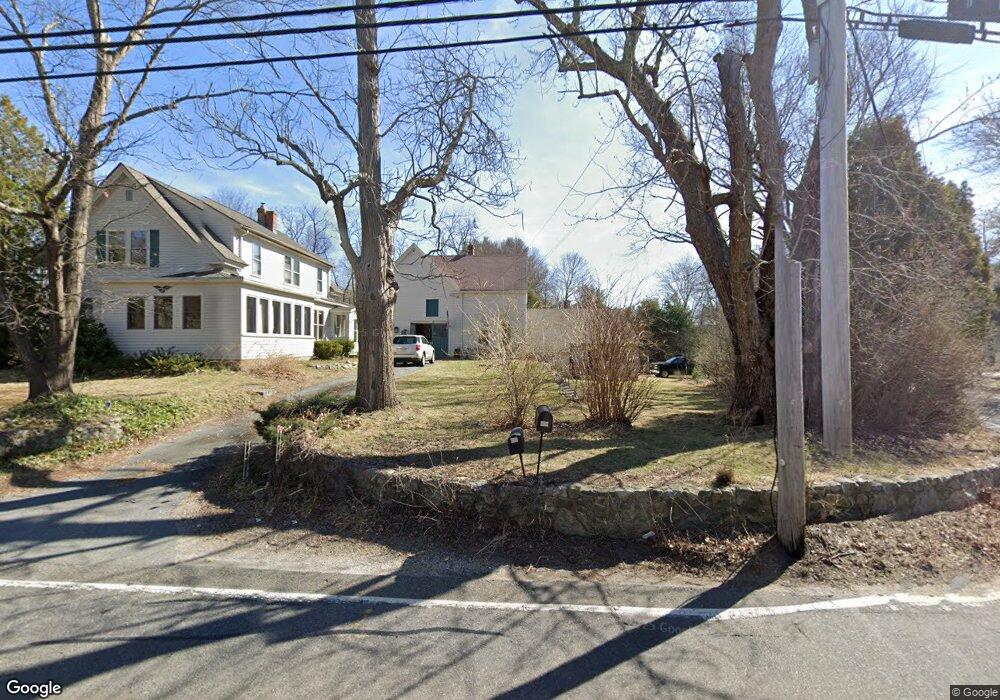
479 Whiting St Hanover, MA 02339
Estimated Value: $790,347 - $882,000
4
Beds
2
Baths
2,251
Sq Ft
$372/Sq Ft
Est. Value
About This Home
This home is located at 479 Whiting St, Hanover, MA 02339 and is currently estimated at $837,587, approximately $372 per square foot. 479 Whiting St is a home located in Plymouth County with nearby schools including Hanover High School, Calvary Chapel Academy, and Holy Family Elementary School.
Ownership History
Date
Name
Owned For
Owner Type
Purchase Details
Closed on
Mar 24, 2010
Sold by
Henderson James S
Bought by
Henderson James S and Jenkins Sylvia
Current Estimated Value
Purchase Details
Closed on
Aug 31, 1994
Sold by
Henderson Donna L and Henderson Nancy E
Bought by
Henderson Donna L
Create a Home Valuation Report for This Property
The Home Valuation Report is an in-depth analysis detailing your home's value as well as a comparison with similar homes in the area
Home Values in the Area
Average Home Value in this Area
Purchase History
| Date | Buyer | Sale Price | Title Company |
|---|---|---|---|
| Henderson James S | -- | -- | |
| Henderson Donna L | $65,000 | -- |
Source: Public Records
Mortgage History
| Date | Status | Borrower | Loan Amount |
|---|---|---|---|
| Previous Owner | Henderson Donna L | $100,000 | |
| Previous Owner | Henderson Donna L | $37,800 | |
| Previous Owner | Henderson Donna L | $55,000 | |
| Previous Owner | Henderson Donna L | $75,000 |
Source: Public Records
Tax History
| Year | Tax Paid | Tax Assessment Tax Assessment Total Assessment is a certain percentage of the fair market value that is determined by local assessors to be the total taxable value of land and additions on the property. | Land | Improvement |
|---|---|---|---|---|
| 2025 | $8,166 | $661,200 | $269,600 | $391,600 |
| 2024 | $7,925 | $617,200 | $269,600 | $347,600 |
| 2023 | $7,952 | $589,500 | $245,100 | $344,400 |
| 2022 | $8,281 | $543,000 | $245,100 | $297,900 |
| 2021 | $6,810 | $520,100 | $222,800 | $297,300 |
| 2020 | $6,449 | $515,600 | $222,800 | $292,800 |
| 2019 | $3,535 | $484,600 | $222,800 | $261,800 |
| 2018 | $6,058 | $485,100 | $222,800 | $262,300 |
| 2017 | $5,818 | $391,100 | $210,000 | $181,100 |
| 2016 | $5,928 | $351,600 | $191,000 | $160,600 |
| 2015 | $5,381 | $333,200 | $191,000 | $142,200 |
Source: Public Records
Map
Nearby Homes
- 73 Shingle Mill Ln
- 738 Whiting St
- 36 Bayberry Ln
- 206-208 Hinghm St
- 18 Winterberry Ln
- 50 Village Ln
- 46 Brookwood Rd
- 436 E Water St
- 8 Blueberry Ct
- 5 Blueberry Ct
- 47 Stone Meadow Ln
- 44 Stone Meadow Ln
- 14 Pleasant View Park
- 55 Turner Rd
- 535 Webster St
- 18 Colby St
- 776 Main St
- 117 Liberty St
- 98 Myrtle St
- 7 Boxberry Ln Unit 7
- 495 Whiting St
- 137 North St
- 26 Holly Berry Ln
- 144 North St
- 474 Whiting St
- 482 Whiting St
- 503 Whiting St
- 44 Holly Berry Ln
- 459 Whiting St
- 506 Whiting St
- 128 North St
- 11 Holly Berry Ln
- 000 Holly Farms Subdiv
- 521 Whiting St
- 7 Whistle Berry Cir
- 447 Whiting St
- 518 Whiting St
- 111 North St
- 462 Whiting St
- 58 Holly Berry Ln
Your Personal Tour Guide
Ask me questions while you tour the home.