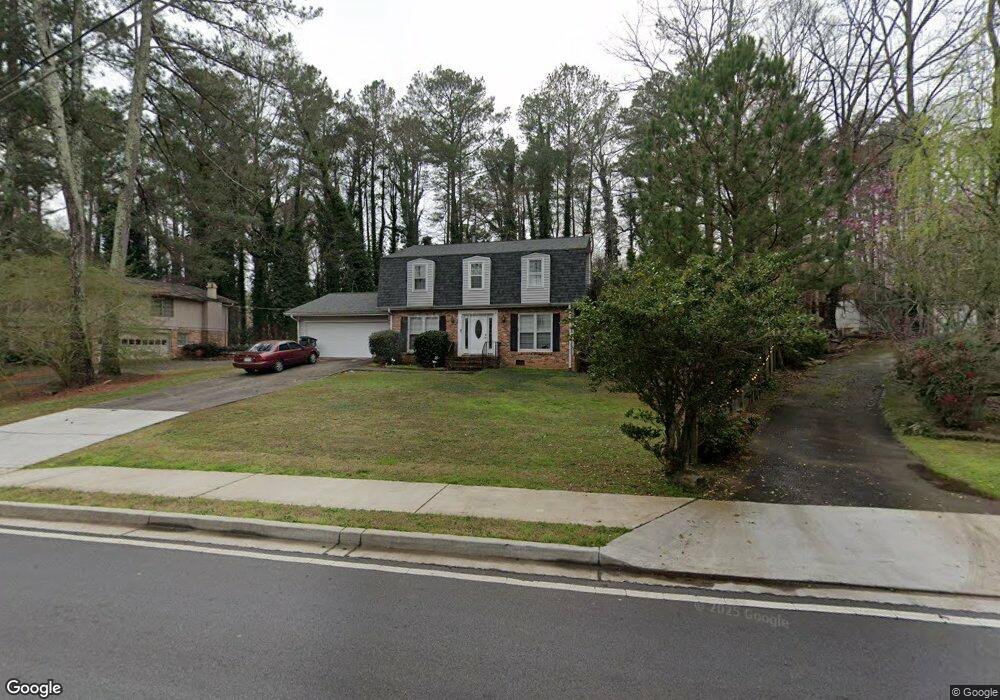
4791 Mcpherson Rd NE Roswell, GA 30075
East Cobb NeighborhoodEstimated Value: $504,000 - $600,942
4
Beds
3
Baths
2,182
Sq Ft
$258/Sq Ft
Est. Value
About This Home
This home is located at 4791 Mcpherson Rd NE, Roswell, GA 30075 and is currently estimated at $563,986, approximately $258 per square foot. 4791 Mcpherson Rd NE is a home located in Cobb County with nearby schools including Tritt Elementary School, Hightower Trail Middle School, and Pope High School.
Ownership History
Date
Name
Owned For
Owner Type
Purchase Details
Closed on
Jul 8, 2025
Sold by
Javer Christopher A
Bought by
Javer Christopher A and Javer Sandy
Current Estimated Value
Home Financials for this Owner
Home Financials are based on the most recent Mortgage that was taken out on this home.
Original Mortgage
$339,845
Outstanding Balance
$339,274
Interest Rate
6.89%
Mortgage Type
FHA
Estimated Equity
$224,712
Purchase Details
Closed on
Apr 13, 2011
Sold by
Bank Of New York M 2005 & Ab4
Bought by
Javer Christopher A
Home Financials for this Owner
Home Financials are based on the most recent Mortgage that was taken out on this home.
Original Mortgage
$111,012
Interest Rate
3.75%
Mortgage Type
FHA
Purchase Details
Closed on
Mar 2, 2010
Sold by
Oneal James P and Oneal Susan N
Bought by
Bank Of Ny
Purchase Details
Closed on
Jul 24, 2003
Sold by
Edward Hanna and Edward Karen A
Bought by
Oneal Susan N and Oneal James
Home Financials for this Owner
Home Financials are based on the most recent Mortgage that was taken out on this home.
Original Mortgage
$178,640
Interest Rate
5.52%
Mortgage Type
FHA
Create a Home Valuation Report for This Property
The Home Valuation Report is an in-depth analysis detailing your home's value as well as a comparison with similar homes in the area
Home Values in the Area
Average Home Value in this Area
Purchase History
| Date | Buyer | Sale Price | Title Company |
|---|---|---|---|
| Javer Christopher A | -- | None Listed On Document | |
| Javer Christopher A | -- | None Listed On Document | |
| Javer Christopher A | $113,900 | -- | |
| Bank Of Ny | $153,000 | -- | |
| Oneal Susan N | $184,000 | -- |
Source: Public Records
Mortgage History
| Date | Status | Borrower | Loan Amount |
|---|---|---|---|
| Open | Javer Christopher A | $339,845 | |
| Closed | Javer Christopher A | $339,845 | |
| Previous Owner | Javer Christopher A | $111,012 | |
| Previous Owner | Oneal Susan N | $178,640 |
Source: Public Records
Tax History Compared to Growth
Tax History
| Year | Tax Paid | Tax Assessment Tax Assessment Total Assessment is a certain percentage of the fair market value that is determined by local assessors to be the total taxable value of land and additions on the property. | Land | Improvement |
|---|---|---|---|---|
| 2025 | $4,239 | $190,356 | $48,000 | $142,356 |
| 2024 | $4,242 | $190,356 | $48,000 | $142,356 |
| 2023 | $3,693 | $190,064 | $44,000 | $146,064 |
| 2022 | $3,483 | $154,020 | $35,200 | $118,820 |
| 2021 | $2,864 | $125,756 | $35,200 | $90,556 |
| 2020 | $2,864 | $125,756 | $35,200 | $90,556 |
| 2019 | $2,864 | $125,756 | $35,200 | $90,556 |
| 2018 | $2,288 | $99,448 | $30,000 | $69,448 |
| 2017 | $2,238 | $99,448 | $30,000 | $69,448 |
| 2016 | $2,070 | $91,540 | $30,000 | $61,540 |
| 2015 | $1,920 | $83,072 | $24,000 | $59,072 |
| 2014 | $1,931 | $83,072 | $0 | $0 |
Source: Public Records
Map
Nearby Homes
- 3025 Creek Ct NE
- 4618 Shallowford Rd
- 4574 Woodland Cir NE
- 4645 Shallowford Rd
- 2990 Mountain Trace NE
- 3333 Trails End Rd NE
- 4486 Huffman Dr NE
- 3226 Artessa Ln NE
- 4448 Huffman Dr NE
- 3231 Artessa Ln NE
- 3277 Artessa Ln NE
- 1533 Tennessee Walker Dr NE
- 2859 Tynewick Dr NE
- 3453 Drayton Dr NE
- 4680 Cambridge Approach Cir NE
- 2993 Byrons Green Ct
- 230 Tynebrae Place Unit 1
- 4781 Mcpherson Rd NE
- 4801 Mcpherson Rd NE
- 4777 Mcpherson Rd NE
- 4488 Mountain Creek Dr NE
- 4482 Mountain Creek Dr NE Unit 4
- 4724 Shallowford Rd
- 4761 Mcpherson Rd NE Unit 4
- 4494 Mountain Creek Dr NE
- 3158 Denton Place NE
- 4476 Mountain Creek Dr NE
- 3160 Denton Place NE Unit 1
- 4714 Shallowford Rd
- 4500 Mountain Creek Dr NE
- 3156 Denton Place NE
- 3100 Mcpherson Rd NE
- 3162 Denton Place NE
- 4751 Mcpherson Rd NE
- 4466 Mountain Creek Dr NE Unit 4
- 3154 Denton Place NE
- 4506 Mountain Creek Dr NE