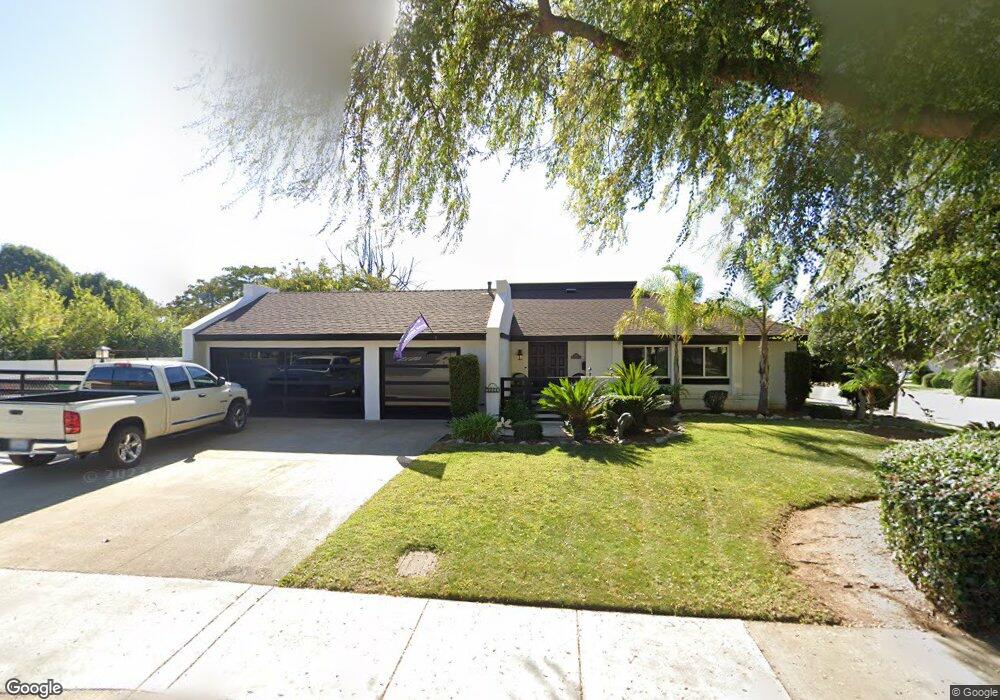
4792 Cadley Dr La Verne, CA 91750
North La Verne NeighborhoodEstimated Value: $888,000 - $1,115,000
4
Beds
2
Baths
1,632
Sq Ft
$608/Sq Ft
Est. Value
About This Home
This home is located at 4792 Cadley Dr, La Verne, CA 91750 and is currently estimated at $991,858, approximately $607 per square foot. 4792 Cadley Dr is a home located in Los Angeles County with nearby schools including La Verne Heights Elementary School, Ramona Middle School, and Bonita High School.
Ownership History
Date
Name
Owned For
Owner Type
Purchase Details
Closed on
Aug 12, 2025
Sold by
Davis Mindy
Bought by
Mindy Davis Revocable Trust and Davis
Current Estimated Value
Purchase Details
Closed on
Apr 22, 2016
Sold by
Davis Darren
Bought by
Davis Mindy
Home Financials for this Owner
Home Financials are based on the most recent Mortgage that was taken out on this home.
Original Mortgage
$459,146
Interest Rate
3.87%
Mortgage Type
FHA
Purchase Details
Closed on
Apr 6, 2016
Sold by
Vander Linde Robert
Bought by
Davis Mindy and Miller Tamara L
Home Financials for this Owner
Home Financials are based on the most recent Mortgage that was taken out on this home.
Original Mortgage
$459,146
Interest Rate
3.87%
Mortgage Type
FHA
Purchase Details
Closed on
May 1, 2001
Sold by
Vanderlinde Fred R
Bought by
Vanderlinde Fred R and Fred R Vanderlinde Trust Of 2001
Create a Home Valuation Report for This Property
The Home Valuation Report is an in-depth analysis detailing your home's value as well as a comparison with similar homes in the area
Home Values in the Area
Average Home Value in this Area
Purchase History
| Date | Buyer | Sale Price | Title Company |
|---|---|---|---|
| Mindy Davis Revocable Trust | -- | None Listed On Document | |
| Davis Mindy | -- | None Listed On Document | |
| Davis Mindy | -- | Multiple | |
| Davis Mindy | $475,000 | Chicago Title Inland Empire | |
| Vanderlinde Fred R | -- | -- |
Source: Public Records
Mortgage History
| Date | Status | Borrower | Loan Amount |
|---|---|---|---|
| Previous Owner | Davis Mindy | $459,146 |
Source: Public Records
Tax History
| Year | Tax Paid | Tax Assessment Tax Assessment Total Assessment is a certain percentage of the fair market value that is determined by local assessors to be the total taxable value of land and additions on the property. | Land | Improvement |
|---|---|---|---|---|
| 2025 | $6,652 | $562,297 | $449,840 | $112,457 |
| 2024 | $6,652 | $551,272 | $441,020 | $110,252 |
| 2023 | $6,504 | $540,464 | $432,373 | $108,091 |
| 2022 | $6,399 | $529,868 | $423,896 | $105,972 |
| 2021 | $6,279 | $519,480 | $415,585 | $103,895 |
| 2019 | $6,157 | $504,073 | $403,259 | $100,814 |
| 2018 | $5,852 | $494,190 | $395,352 | $98,838 |
| 2016 | $2,145 | $161,285 | $35,620 | $125,665 |
| 2015 | $2,113 | $158,863 | $35,085 | $123,778 |
| 2014 | $2,103 | $155,752 | $34,398 | $121,354 |
Source: Public Records
Map
Nearby Homes
- 1222 Cynthia Ct
- 1218 Oak View Ln
- 3620 Moreno Ave
- 3620 Moreno Ave Unit 64
- 3620 Moreno Ave Unit 15
- 3620 Moreno Ave Unit 121
- 3530 Damien #13 Ave
- 1623 Heather Dr
- 3832 Bixby Dr
- 5893 Via Marcia
- 930 La Rue Ave
- 873 Dogwood Dr
- 3713 Helena Cir
- 5905 Old Wheeler Rd
- 4265 Emerald Ave
- 3322 Damien Ave
- 4525 Ramona Ave Unit 12
- 15 Yucca Ct Unit 15
- 3530 Damien Ave Unit 44
- 3530 Damien Ave Unit 62
- 1338 Ruggles St
- 4778 Cadley Dr
- 1318 Ruggles St
- 1337 Ruggles St
- 1317 Danton St
- 1327 Ruggles St
- 4808 Cadley Dr
- 1336 Danton St
- 1319 Ruggles St
- 1304 Ruggles St
- 1328 Danton St
- 1303 Danton St
- 1320 Deventer Dr
- 1316 Danton St
- 1305 Ruggles St
- 4820 Cadley Dr
- 1304 Deventer Dr
- 1294 Ruggles St
- 1293 Danton St
- 1302 Danton St
Your Personal Tour Guide
Ask me questions while you tour the home.