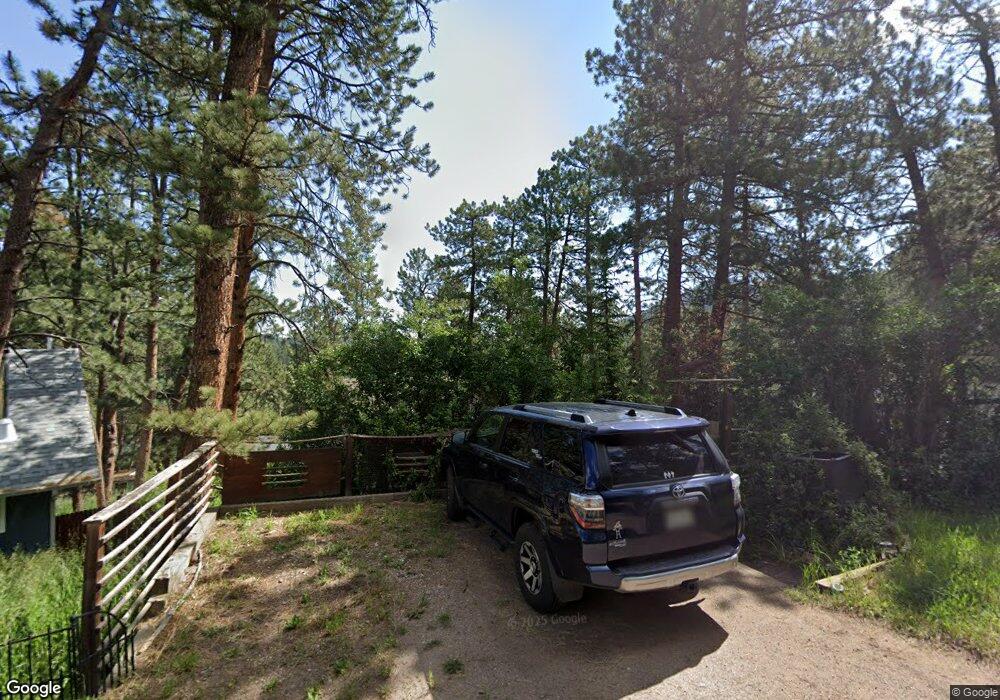
4794 S Pine Rd Evergreen, CO 80439
Estimated Value: $497,509 - $644,000
3
Beds
3
Baths
776
Sq Ft
$725/Sq Ft
Est. Value
About This Home
This home is located at 4794 S Pine Rd, Evergreen, CO 80439 and is currently estimated at $562,377, approximately $724 per square foot. 4794 S Pine Rd is a home located in Jefferson County with nearby schools including Wilmot Elementary School, Evergreen Middle School, and Evergreen High School.
Ownership History
Date
Name
Owned For
Owner Type
Purchase Details
Closed on
Sep 15, 1999
Sold by
Bartelt Karen J
Bought by
Mendoza Mark J
Current Estimated Value
Home Financials for this Owner
Home Financials are based on the most recent Mortgage that was taken out on this home.
Original Mortgage
$152,500
Outstanding Balance
$45,489
Interest Rate
7.9%
Estimated Equity
$516,888
Purchase Details
Closed on
Nov 27, 1996
Sold by
Schaufus Paul D and Schaufus Alison T
Bought by
Bartelt Karen J
Home Financials for this Owner
Home Financials are based on the most recent Mortgage that was taken out on this home.
Original Mortgage
$135,000
Interest Rate
7.71%
Purchase Details
Closed on
May 24, 1994
Sold by
Macmillan Janet A
Bought by
Schaufus Paul D and Schaufus Alison T
Home Financials for this Owner
Home Financials are based on the most recent Mortgage that was taken out on this home.
Original Mortgage
$90,250
Interest Rate
5.87%
Create a Home Valuation Report for This Property
The Home Valuation Report is an in-depth analysis detailing your home's value as well as a comparison with similar homes in the area
Purchase History
| Date | Buyer | Sale Price | Title Company |
|---|---|---|---|
| Mendoza Mark J | $169,500 | -- | |
| Bartelt Karen J | $150,000 | -- | |
| Schaufus Paul D | $95,000 | -- |
Source: Public Records
Mortgage History
| Date | Status | Borrower | Loan Amount |
|---|---|---|---|
| Open | Mendoza Mark J | $152,500 | |
| Previous Owner | Bartelt Karen J | $135,000 | |
| Previous Owner | Schaufus Paul D | $90,250 |
Source: Public Records
Tax History
| Year | Tax Paid | Tax Assessment Tax Assessment Total Assessment is a certain percentage of the fair market value that is determined by local assessors to be the total taxable value of land and additions on the property. | Land | Improvement |
|---|---|---|---|---|
| 2024 | $2,808 | $30,613 | $8,703 | $21,910 |
| 2023 | $2,808 | $30,613 | $8,703 | $21,910 |
| 2022 | $2,240 | $23,707 | $6,504 | $17,203 |
| 2021 | $2,263 | $24,390 | $6,692 | $17,698 |
| 2020 | $1,812 | $19,383 | $3,741 | $15,642 |
| 2019 | $1,787 | $19,383 | $3,741 | $15,642 |
| 2018 | $1,692 | $17,756 | $3,069 | $14,687 |
| 2017 | $1,541 | $17,756 | $3,069 | $14,687 |
| 2016 | $1,687 | $18,166 | $4,944 | $13,222 |
| 2015 | $1,294 | $18,166 | $4,944 | $13,222 |
| 2014 | $1,294 | $13,519 | $3,744 | $9,775 |
Source: Public Records
Map
Nearby Homes
- 4812 S Cedar Rd
- 4788 Blue Spruce Rd
- 0 S Pine Rd
- 4997 Camel Heights Rd
- 5091 S Olive Rd
- 5000 Elizabeth Ln
- 5237 S Olive Rd
- 5157 Mountain Vista Ln
- 28449 Douglas Park Rd
- 5033 Hillstone Ln
- 28277 Lone Elk Trail
- 28609 Pine Dr
- 5233 S Road A
- 5277 Mountain Vista Ln
- 27901 Pine Dr
- 0000 S Indian Trail
- 27225 Mountain Park Rd
- 5162 S Road A
- 29611 Fairway Dr
- 27972 Meadow Dr Unit 220
- 4784 S Pine Rd
- 4804 S Pine Rd
- 4774 S Pine Rd
- 4773 S Cedar Rd
- 4783 S Cedar Rd
- 4814 S Pine Rd
- 4855 S Pine Rd
- 4763 S Cedar Rd
- 4845 S Pine Rd
- 4793 S Cedar Rd
- 0 S Cedar Rd
- 4753 S Cedar Rd
- 4842 Juniper Ln
- 4824 S Pine Rd
- 4835 S Pine Rd
- 4865 S Pine Rd
- 4782 S Cedar Rd
- 4803 S Cedar Rd
- 4792 S Cedar Rd
- 4704 S Pine Rd
Your Personal Tour Guide
Ask me questions while you tour the home.