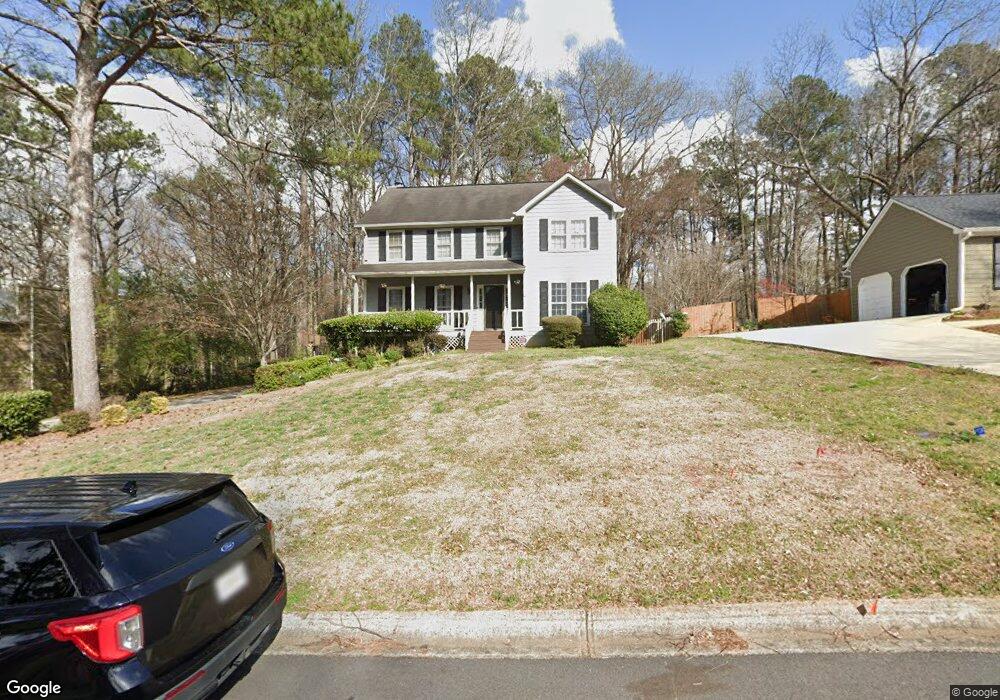
4795 Langford Ct SW Unit 21 Mableton, GA 30126
Estimated Value: $418,744 - $444,000
4
Beds
3
Baths
2,774
Sq Ft
$155/Sq Ft
Est. Value
About This Home
This home is located at 4795 Langford Ct SW Unit 21, Mableton, GA 30126 and is currently estimated at $429,686, approximately $154 per square foot. 4795 Langford Ct SW Unit 21 is a home located in Cobb County with nearby schools including Mableton Elementary School, Floyd Middle School, and Covered Bridge Academy.
Ownership History
Date
Name
Owned For
Owner Type
Purchase Details
Closed on
Dec 10, 2019
Sold by
Johnson Tawanda
Bought by
Henderson Derrick V
Current Estimated Value
Home Financials for this Owner
Home Financials are based on the most recent Mortgage that was taken out on this home.
Original Mortgage
$250,381
Outstanding Balance
$220,708
Interest Rate
3.7%
Mortgage Type
New Conventional
Estimated Equity
$208,978
Purchase Details
Closed on
Dec 28, 2010
Sold by
White Jonathan E and White Lovell M
Bought by
Johnson Tawanda
Home Financials for this Owner
Home Financials are based on the most recent Mortgage that was taken out on this home.
Original Mortgage
$187,619
Interest Rate
4.25%
Mortgage Type
FHA
Purchase Details
Closed on
Oct 25, 2002
Sold by
Geller Robert J and Geller Janice L
Bought by
White Jonathan E and White Lovell M
Home Financials for this Owner
Home Financials are based on the most recent Mortgage that was taken out on this home.
Original Mortgage
$162,800
Interest Rate
5.99%
Mortgage Type
New Conventional
Create a Home Valuation Report for This Property
The Home Valuation Report is an in-depth analysis detailing your home's value as well as a comparison with similar homes in the area
Home Values in the Area
Average Home Value in this Area
Purchase History
| Date | Buyer | Sale Price | Title Company |
|---|---|---|---|
| Henderson Derrick V | $255,000 | -- | |
| Johnson Tawanda | $192,500 | -- | |
| White Jonathan E | $203,500 | -- |
Source: Public Records
Mortgage History
| Date | Status | Borrower | Loan Amount |
|---|---|---|---|
| Open | Henderson Derrick V | $250,381 | |
| Previous Owner | Johnson Tawanda | $187,619 | |
| Previous Owner | White Jonathan E | $162,800 |
Source: Public Records
Tax History Compared to Growth
Tax History
| Year | Tax Paid | Tax Assessment Tax Assessment Total Assessment is a certain percentage of the fair market value that is determined by local assessors to be the total taxable value of land and additions on the property. | Land | Improvement |
|---|---|---|---|---|
| 2025 | $3,931 | $154,108 | $22,000 | $132,108 |
| 2024 | $3,934 | $154,108 | $22,000 | $132,108 |
| 2023 | $3,391 | $154,108 | $22,000 | $132,108 |
| 2022 | $2,704 | $98,124 | $22,000 | $76,124 |
| 2021 | $3,096 | $102,000 | $21,360 | $80,640 |
| 2020 | $3,096 | $102,000 | $21,360 | $80,640 |
| 2019 | $2,674 | $104,908 | $22,000 | $82,908 |
| 2018 | $2,674 | $104,908 | $22,000 | $82,908 |
| 2017 | $2,202 | $88,152 | $16,000 | $72,152 |
| 2016 | $2,023 | $79,932 | $18,000 | $61,932 |
| 2015 | $2,074 | $79,932 | $18,000 | $61,932 |
| 2014 | $1,955 | $74,628 | $0 | $0 |
Source: Public Records
Map
Nearby Homes
- 450 Dorset Way SW
- 647 Shannon Green Cir SW
- 221 Shady Ln SW
- 4800 Timberland Dr SW
- 680 Sundial Ln
- 637 Carlouetta Rd SW
- 684 Sundial Ln
- 26 Flint Ridge Dr SE
- 188 Covered Bridge Trail SW
- Jasper-Townhome Plan at Park View Reserve - Hometown Series
- Madeline-Townhome Plan at Park View Reserve - Hometown Series
- 639 Concord Rd SW
- 35 Dunaire Ct SW
- 414 Landers Dr SW Unit 1
- 4487 S Springwood Dr SW
- 4672 Vernon Dr SW
- 187 Fontaine Rd SW
- 4795 Langford Ct SW
- 4799 Langford Ct SW
- 4793 Langford Ct SW
- 0 Langford Ct SW Unit 7471426
- 0 Langford Ct SW Unit 7181725
- 0 Langford Ct SW Unit 7034107
- 0 Langford Ct SW Unit 7015701
- 0 Langford Ct SW Unit 3244420
- 0 Langford Ct SW Unit 8847402
- 0 Langford Ct SW Unit 8695648
- 0 Langford Ct SW Unit 8182917
- 400 Chrispen Trace SW
- 4801 Langford Ct SW
- 4791 Langford Ct SW
- 4796 Langford Ct SW
- 410 Chrispen Trace SW
- 401 Chrispen Trace SW
- 4803 Langford Ct SW
- 4794 Langford Ct SW
- 4789 Langford Ct SW