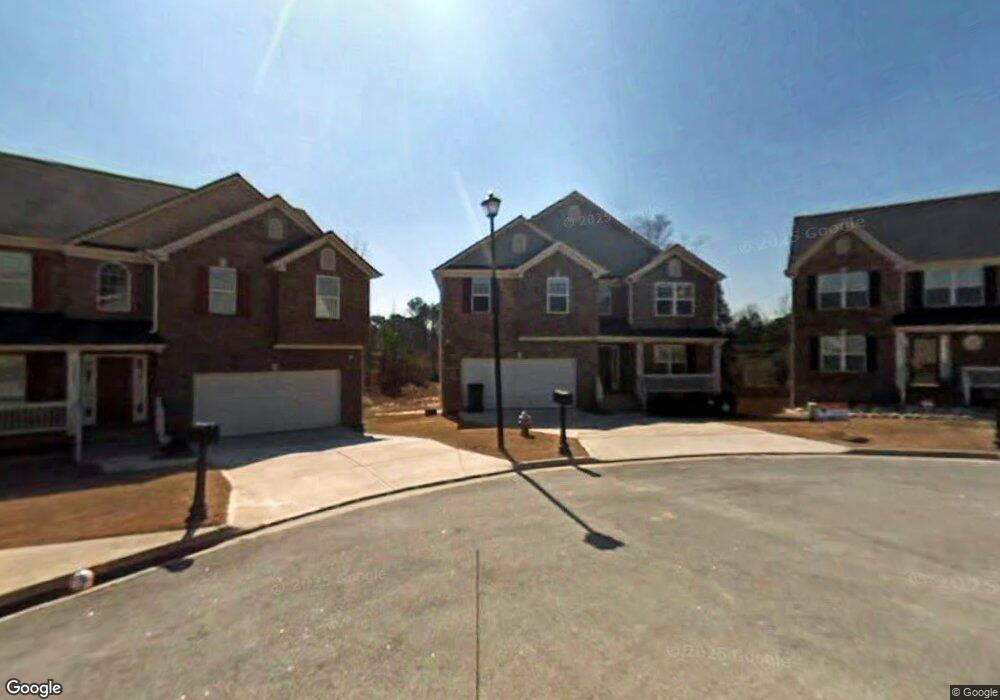
4796 Beau Point Ct SW Snellville, GA 30039
Estimated Value: $378,000 - $412,000
4
Beds
3
Baths
3,809
Sq Ft
$104/Sq Ft
Est. Value
About This Home
This home is located at 4796 Beau Point Ct SW, Snellville, GA 30039 and is currently estimated at $394,279, approximately $103 per square foot. 4796 Beau Point Ct SW is a home located in Gwinnett County with nearby schools including Rosebud Elementary School, Grace Snell Middle School, and South Gwinnett High School.
Ownership History
Date
Name
Owned For
Owner Type
Purchase Details
Closed on
Jun 4, 2019
Sold by
Johnson-Bey Taknisha
Bought by
Adames Janine
Current Estimated Value
Home Financials for this Owner
Home Financials are based on the most recent Mortgage that was taken out on this home.
Original Mortgage
$225,834
Outstanding Balance
$199,813
Interest Rate
4.62%
Mortgage Type
FHA
Estimated Equity
$194,466
Purchase Details
Closed on
Mar 27, 2008
Sold by
Trust Series 2006-He2
Bought by
Johnson-Bey Taknisha
Home Financials for this Owner
Home Financials are based on the most recent Mortgage that was taken out on this home.
Original Mortgage
$168,743
Interest Rate
6.22%
Mortgage Type
FHA
Purchase Details
Closed on
Dec 4, 2007
Sold by
Bawa James B and Bawa Philippa S
Bought by
Lasalle Bk Na Series 2006-He2
Purchase Details
Closed on
Oct 28, 2005
Sold by
Damascus Homes Llc
Bought by
Bawa James B and Bawa Philippa
Home Financials for this Owner
Home Financials are based on the most recent Mortgage that was taken out on this home.
Original Mortgage
$187,404
Interest Rate
8.05%
Mortgage Type
New Conventional
Create a Home Valuation Report for This Property
The Home Valuation Report is an in-depth analysis detailing your home's value as well as a comparison with similar homes in the area
Home Values in the Area
Average Home Value in this Area
Purchase History
| Date | Buyer | Sale Price | Title Company |
|---|---|---|---|
| Adames Janine | $230,000 | -- | |
| Johnson-Bey Taknisha | $175,000 | -- | |
| Lasalle Bk Na Series 2006-He2 | $166,200 | -- | |
| Bawa James B | $234,300 | -- |
Source: Public Records
Mortgage History
| Date | Status | Borrower | Loan Amount |
|---|---|---|---|
| Open | Adames Janine | $225,834 | |
| Previous Owner | Johnson-Bey Taknisha | $168,743 | |
| Previous Owner | Bawa James B | $187,404 |
Source: Public Records
Tax History Compared to Growth
Tax History
| Year | Tax Paid | Tax Assessment Tax Assessment Total Assessment is a certain percentage of the fair market value that is determined by local assessors to be the total taxable value of land and additions on the property. | Land | Improvement |
|---|---|---|---|---|
| 2025 | $4,457 | $150,120 | $30,000 | $120,120 |
| 2024 | $4,548 | $148,440 | $30,000 | $118,440 |
| 2023 | $4,548 | $138,960 | $29,680 | $109,280 |
| 2022 | $4,154 | $131,280 | $22,000 | $109,280 |
| 2021 | $3,641 | $103,920 | $14,000 | $89,920 |
| 2020 | $3,393 | $91,360 | $14,000 | $77,360 |
| 2019 | $3,542 | $99,000 | $14,000 | $85,000 |
| 2018 | $3,225 | $89,880 | $12,000 | $77,880 |
| 2016 | $2,384 | $65,280 | $10,000 | $55,280 |
| 2015 | $2,183 | $58,880 | $8,800 | $50,080 |
| 2014 | -- | $58,880 | $8,800 | $50,080 |
Source: Public Records
Map
Nearby Homes
- 4738 Chafin Point Ct
- 3770 Belle Glade Trail
- 3630 Gin Way Unit 1
- 3851 Brittan Glade Trail
- 4840 Heather Mill Trace
- 3576 Iron Hearth Bend
- 3576 Iron Hearth Bend Unit 92C
- Jackson Plan at Crofton Place - Enclave Collection
- Mayfield Plan at Crofton Place - Enclave Collection
- Chestnut Plan at Crofton Place - Enclave Collection
- Davenport Plan at Crofton Place - Enclave Collection
- The Turnbridge Plan at Crofton Place - Manor Collection
- Pembrooke Plan at Crofton Place - Enclave Collection
- The Stanford Plan at Crofton Place - Estates Collection
- The Cambridge Plan at Crofton Place - Manor Collection
- The Rosewood Plan at Crofton Place - Manor Collection
- The Canterbury Plan at Crofton Place - Manor Collection
- Coleford Plan at Crofton Place - Enclave Collection
- 3556 Iron Hearth Bend
- 3556 Iron Hearth Bend Unit 94C
- 4796 Beau Point Ct
- 4786 Beau Point Ct
- 4783 Beau Point Ct
- 4776 Beau Point Ct
- 4773 Beau Point Ct SW
- 4773 Beau Point Ct
- 4766 Beau Point Ct
- 4763 Beau Point Ct
- 4756 Beau Point Ct
- 4753 Beau Point Ct
- 4746 Beau Point Ct
- 4743 Beau Point Ct
- 4726 Beau Point Ct
- 4733 Beau Point Ct SW
- 4733 Beau Point Ct
- 4716 Beau Point Ct
- 4716 Beau Point Ct SW
- 4723 Beau Point Ct
- 3570 Grand Manor Trail
- 4703 Beau Point Ct