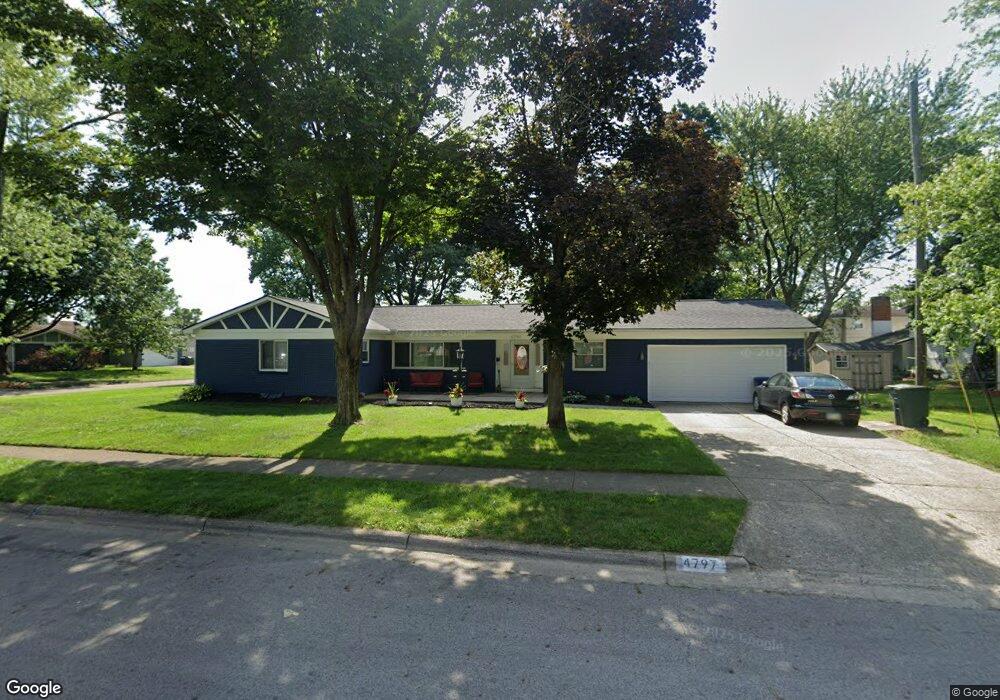
4797 Dechant Rd Columbus, OH 43229
Woodward Park NeighborhoodEstimated Value: $303,000 - $342,000
3
Beds
2
Baths
1,728
Sq Ft
$187/Sq Ft
Est. Value
About This Home
This home is located at 4797 Dechant Rd, Columbus, OH 43229 and is currently estimated at $323,675, approximately $187 per square foot. 4797 Dechant Rd is a home located in Franklin County with nearby schools including Valley Forge Elementary School, Woodward Park Middle School, and Northland High School.
Ownership History
Date
Name
Owned For
Owner Type
Purchase Details
Closed on
May 19, 2016
Sold by
Nutt Lenell
Bought by
Nutt Lenell and Nutt Shalonda Drew
Current Estimated Value
Purchase Details
Closed on
Oct 5, 2010
Sold by
Household Realty Corporation
Bought by
Nutt Lenell
Home Financials for this Owner
Home Financials are based on the most recent Mortgage that was taken out on this home.
Original Mortgage
$72,917
Outstanding Balance
$49,536
Interest Rate
5.25%
Mortgage Type
FHA
Estimated Equity
$274,139
Purchase Details
Closed on
Jan 21, 2010
Sold by
Rodgers Delphine
Bought by
Household Realty Corporation
Purchase Details
Closed on
Mar 13, 1998
Sold by
Decker Gary R and Decker Diana L
Bought by
Rodgers Gary and Rodgers Delphine
Purchase Details
Closed on
Aug 15, 1989
Create a Home Valuation Report for This Property
The Home Valuation Report is an in-depth analysis detailing your home's value as well as a comparison with similar homes in the area
Home Values in the Area
Average Home Value in this Area
Purchase History
| Date | Buyer | Sale Price | Title Company |
|---|---|---|---|
| Nutt Lenell | -- | None Available | |
| Nutt Lenell | $73,900 | Attorney | |
| Household Realty Corporation | -- | Attorney | |
| Rodgers Gary | $112,000 | Chicago Title | |
| -- | $90,000 | -- |
Source: Public Records
Mortgage History
| Date | Status | Borrower | Loan Amount |
|---|---|---|---|
| Open | Nutt Lenell | $72,917 |
Source: Public Records
Tax History
| Year | Tax Paid | Tax Assessment Tax Assessment Total Assessment is a certain percentage of the fair market value that is determined by local assessors to be the total taxable value of land and additions on the property. | Land | Improvement |
|---|---|---|---|---|
| 2025 | $5,003 | $111,480 | $21,630 | $89,850 |
| 2024 | $5,003 | $111,480 | $21,630 | $89,850 |
| 2023 | $4,939 | $111,475 | $21,630 | $89,845 |
| 2022 | $3,413 | $65,800 | $14,000 | $51,800 |
| 2021 | $3,419 | $65,800 | $14,000 | $51,800 |
| 2020 | $3,423 | $65,800 | $14,000 | $51,800 |
| 2019 | $3,147 | $51,870 | $11,200 | $40,670 |
| 2018 | $3,013 | $51,870 | $11,200 | $40,670 |
| 2017 | $3,162 | $51,870 | $11,200 | $40,670 |
| 2016 | $3,179 | $47,990 | $9,870 | $38,120 |
| 2015 | $2,886 | $47,990 | $9,870 | $38,120 |
| 2014 | $2,893 | $47,990 | $9,870 | $38,120 |
| 2013 | $1,568 | $52,745 | $10,395 | $42,350 |
Source: Public Records
Map
Nearby Homes
- 1116 Tulsa Dr
- 1144 Reed Circle Dr
- 4800 Bourke Rd
- 4795 Colonel Perry Dr
- 4605 Glenmawr Ave
- 1485 Norma Rd
- 4450 N 4th St
- 4923 Karl Rd Unit 4925
- 5004 Julie Place
- 5010 Julie Place
- 952 Minerva Ave
- 940 Minerva Ave
- 4320 Sandy Lane Rd
- 5318 Eisenhower Rd
- 1130 Carbone Dr
- 1685 Norma Rd
- 601 Morse Rd
- 827 Inwood Place
- 899 Meadowview Dr
- 4143 Karl Rd Unit 215
- 1146 Dechant Ct
- 4805 Dechant Rd
- 1145 Tulsa Dr
- 4788 Dechant Rd
- 1134 Dechant Ct
- 4780 Dechant Rd
- 4800 Dechant Rd
- 4767 Dechant Rd
- 1147 Dechant Ct
- 1133 Tulsa Dr
- 4772 Dechant Rd
- 4808 Dechant Rd
- 1126 Dechant Ct
- 1135 Dechant Ct
- 4764 Dechant Rd
- 1125 Tulsa Dr
- 4791 Esterbrook Rd
- 4783 Esterbrook Rd
- 1127 Dechant Ct
- 4799 Esterbrook Rd
Your Personal Tour Guide
Ask me questions while you tour the home.