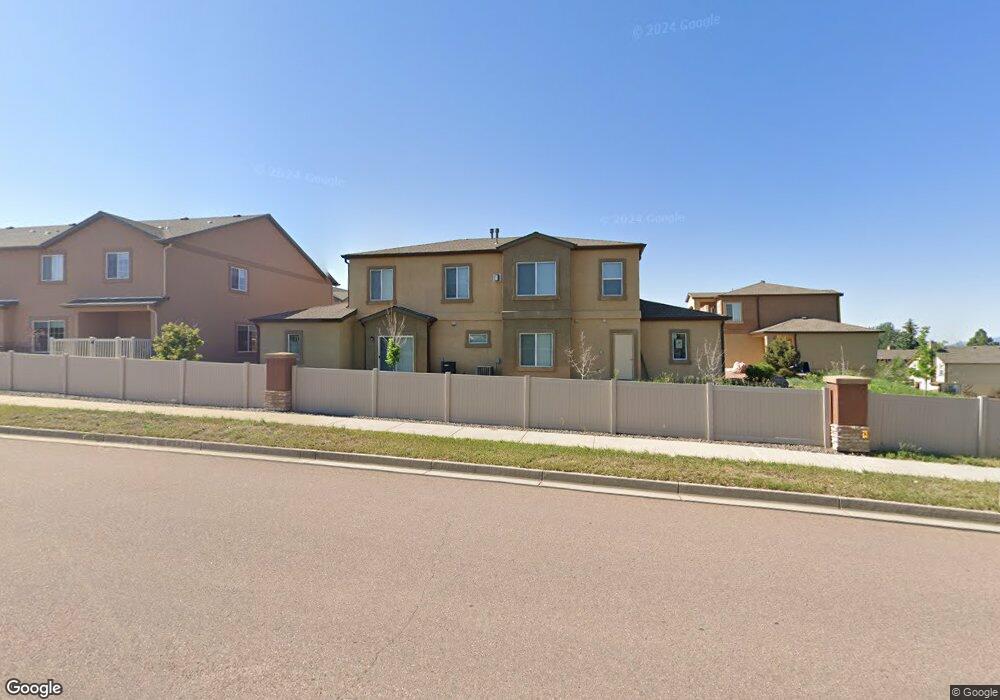
4799 Kerry Lynn View Unit 101 Colorado Springs, CO 80922
Springs Ranch NeighborhoodEstimated Value: $288,000 - $305,953
3
Beds
2
Baths
1,316
Sq Ft
$228/Sq Ft
Est. Value
About This Home
This home is located at 4799 Kerry Lynn View Unit 101, Colorado Springs, CO 80922 and is currently estimated at $300,238, approximately $228 per square foot. 4799 Kerry Lynn View Unit 101 is a home located in El Paso County with nearby schools including Springs Ranch Elementary School, Horizon Middle School, and Sand Creek High School.
Ownership History
Date
Name
Owned For
Owner Type
Purchase Details
Closed on
Jul 3, 2019
Sold by
Oxford Uriah
Bought by
Oxford Uriah
Current Estimated Value
Purchase Details
Closed on
Mar 29, 2013
Sold by
Sharon M Oxford Revocable Living Trust
Bought by
Oxford James L
Home Financials for this Owner
Home Financials are based on the most recent Mortgage that was taken out on this home.
Original Mortgage
$87,168
Outstanding Balance
$61,862
Interest Rate
3.59%
Mortgage Type
VA
Estimated Equity
$238,376
Purchase Details
Closed on
Jun 24, 2011
Sold by
Oxford Sharon M
Bought by
Sharon M Oxford Revocable Living Trust
Purchase Details
Closed on
Oct 24, 2006
Sold by
Stetson 162 Llc
Bought by
Oxford Sharon M
Create a Home Valuation Report for This Property
The Home Valuation Report is an in-depth analysis detailing your home's value as well as a comparison with similar homes in the area
Home Values in the Area
Average Home Value in this Area
Purchase History
| Date | Buyer | Sale Price | Title Company |
|---|---|---|---|
| Oxford Uriah | -- | None Available | |
| Oxford James L | $85,334 | North Amer Title Co Of Co | |
| Sharon M Oxford Revocable Living Trust | -- | None Available | |
| Oxford Sharon M | $177,500 | Stewart Title Of Co Inc |
Source: Public Records
Mortgage History
| Date | Status | Borrower | Loan Amount |
|---|---|---|---|
| Open | Oxford James L | $87,168 |
Source: Public Records
Tax History Compared to Growth
Tax History
| Year | Tax Paid | Tax Assessment Tax Assessment Total Assessment is a certain percentage of the fair market value that is determined by local assessors to be the total taxable value of land and additions on the property. | Land | Improvement |
|---|---|---|---|---|
| 2025 | $1,122 | $22,410 | -- | -- |
| 2024 | $1,023 | $21,720 | $4,290 | $17,430 |
| 2023 | $1,023 | $21,720 | $4,290 | $17,430 |
| 2022 | $1,046 | $16,830 | $2,710 | $14,120 |
| 2021 | $1,090 | $17,320 | $2,790 | $14,530 |
| 2020 | $941 | $14,780 | $2,150 | $12,630 |
| 2019 | $931 | $14,780 | $2,150 | $12,630 |
| 2018 | $747 | $11,630 | $1,690 | $9,940 |
| 2017 | $750 | $11,630 | $1,690 | $9,940 |
| 2016 | $693 | $10,600 | $1,590 | $9,010 |
| 2015 | $694 | $10,600 | $1,590 | $9,010 |
| 2014 | $773 | $11,600 | $1,590 | $10,010 |
Source: Public Records
Map
Nearby Homes
- 7010 Highcroft Dr
- 7120 Highcroft Dr
- 4604 Desert Varnish Dr
- 4632 Hidden River Dr
- 6330 Emma Ln
- 6980 Ashley Dr
- 4489 Crow Creek Dr
- 7084 Ash Creek Heights Unit 201
- 6180 Kettle Ct
- 5275 Belle Star Dr
- 7004 Ash Creek Heights Unit 201
- 4529 Crow Creek Dr
- 7104 Ash Creek Heights Unit 203
- 6170 Katy Ct
- 6984 Ash Creek Heights Unit 204
- 6835 Ashley Dr
- 4831 Desert Varnish Dr
- 5307 Belle Star Dr
- 6185 Hearth Ct
- 4741 Falcons Hood Point
- 4799 Kerry Lynn View Unit 201
- 4797 Kerry Lynn View
- 4795 Kerry Lynn View
- 4793 Kerry Lynn View
- 4808 Kerry Lynn View
- 4810 Kerry Lynn View
- 4791 Kerry Lynn View
- 4798 Kerry Lynn View
- 4812 Kerry Lynn View
- 4789 Kerry Lynn View
- 4796 Kerry Lynn View
- 4807 Kerry Lynn View Unit 202
- 4807 Kerry Lynn View Unit 201
- 4807 Kerry Lynn View Unit 101
- 4794 Kerry Lynn View
- 4816 Kerry Lynn View
- 4755 Dapple Grey Ln
- 4780 Kerry Lynn View
- 4818 Kerry Lynn View
- 4792 Kerry Lynn View