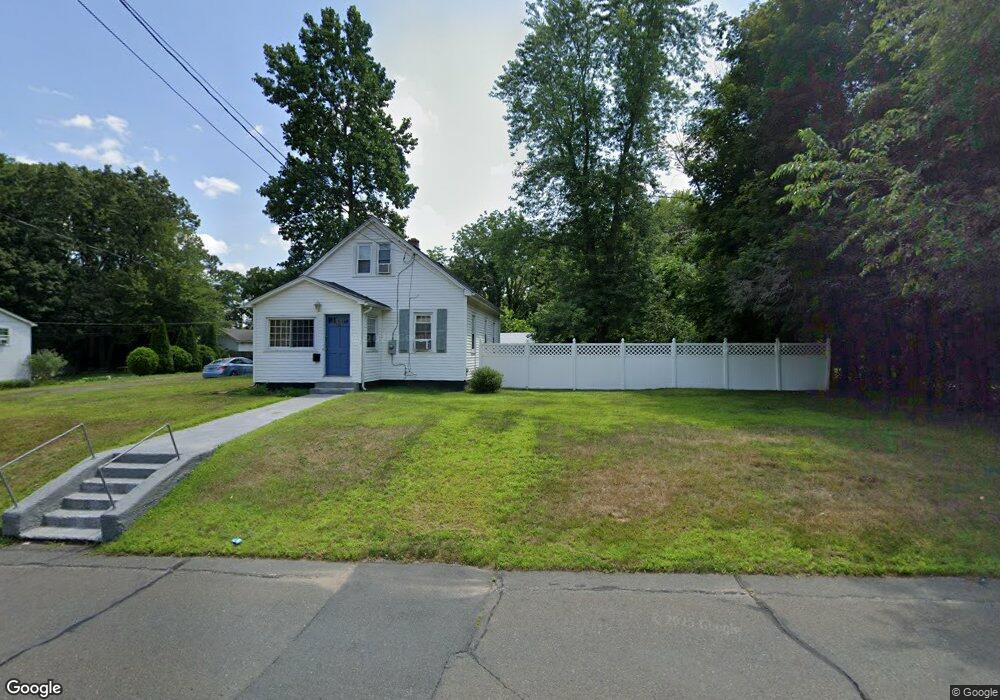
47A Webb St Windsor Locks, CT 06096
Estimated Value: $242,000 - $306,000
3
Beds
2
Baths
972
Sq Ft
$273/Sq Ft
Est. Value
About This Home
This home is located at 47A Webb St, Windsor Locks, CT 06096 and is currently estimated at $265,296, approximately $272 per square foot. 47A Webb St is a home located in Hartford County with nearby schools including North Street School, South Elementary School, and Windsor Locks Middle School.
Ownership History
Date
Name
Owned For
Owner Type
Purchase Details
Closed on
Jan 22, 2013
Sold by
Fedo-Bedinelli Carolyn
Bought by
Applegarth Donald
Current Estimated Value
Purchase Details
Closed on
Jan 13, 2004
Sold by
Gadalla Ragab
Bought by
Congelosi Richard
Purchase Details
Closed on
Jul 3, 1997
Sold by
Young Clay
Bought by
Khedr Tarek
Purchase Details
Closed on
Apr 7, 1989
Sold by
Thompson Joyce
Bought by
Young Clay
Purchase Details
Closed on
Mar 1, 1989
Sold by
Benefield David A
Bought by
Young Clay
Create a Home Valuation Report for This Property
The Home Valuation Report is an in-depth analysis detailing your home's value as well as a comparison with similar homes in the area
Home Values in the Area
Average Home Value in this Area
Purchase History
| Date | Buyer | Sale Price | Title Company |
|---|---|---|---|
| Applegarth Donald | -- | -- | |
| Applegarth Donald | -- | -- | |
| Applegarth Donald | -- | -- | |
| Applegarth Donald | $30,750 | -- | |
| Congelosi Richard | $130,000 | -- | |
| Khedr Tarek | $56,000 | -- | |
| Young Clay | $78,750 | -- | |
| Young Clay | $11,250 | -- |
Source: Public Records
Mortgage History
| Date | Status | Borrower | Loan Amount |
|---|---|---|---|
| Previous Owner | Young Clay | $146,100 | |
| Previous Owner | Young Clay | $146,500 |
Source: Public Records
Tax History
| Year | Tax Paid | Tax Assessment Tax Assessment Total Assessment is a certain percentage of the fair market value that is determined by local assessors to be the total taxable value of land and additions on the property. | Land | Improvement |
|---|---|---|---|---|
| 2025 | $3,669 | $152,950 | $53,760 | $99,190 |
| 2024 | $2,683 | $95,340 | $40,320 | $55,020 |
| 2023 | $2,510 | $95,340 | $40,320 | $55,020 |
| 2022 | $2,463 | $95,340 | $40,320 | $55,020 |
| 2021 | $2,463 | $95,340 | $40,320 | $55,020 |
| 2020 | $2,463 | $95,340 | $40,320 | $55,020 |
| 2019 | $2,463 | $95,340 | $40,320 | $55,020 |
| 2017 | $2,605 | $97,700 | $44,700 | $53,000 |
| 2016 | $2,605 | $97,700 | $44,700 | $53,000 |
| 2015 | $2,617 | $97,700 | $44,700 | $53,000 |
| 2014 | $3,035 | $115,700 | $50,800 | $64,900 |
Source: Public Records
Map
Nearby Homes
- 124 Bel-Aire Cir
- 102 Orchard Hill Dr
- 24 Bel-Aire Cir
- 59 Elm St
- 140 S Water St
- 241 S Water St Unit 11
- 241 S Water St Unit 14
- 94 Raymond Rd
- 19 Dean Ave
- 64 Main St
- 169 Greenwoods Ln Unit 169
- 13 Riverview Dr Unit F
- 217 Adams Hill Way
- 0 N Water St Unit 24138494
- 0 N Water St Unit 24128295
- 0 N Water St Unit 24128294
- 0 N Water St Unit 24128288
- 0 N Water St
- 202 Reed Ave
- 248 Adams Hill Way Unit 248
Your Personal Tour Guide
Ask me questions while you tour the home.