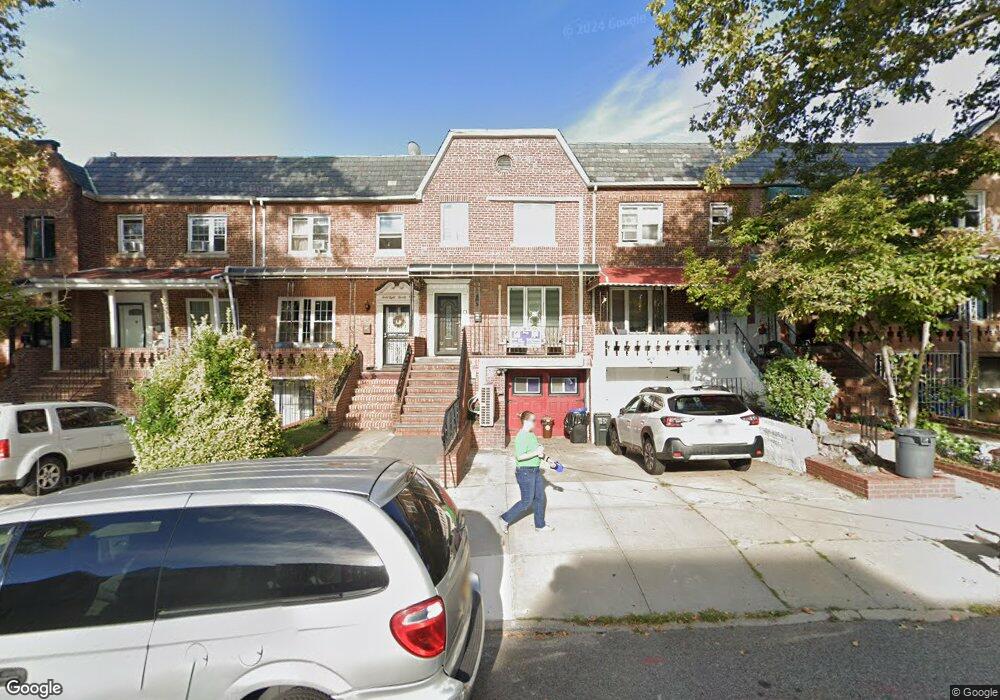
48-26 38 Th St New York City, NY 11101
Long Island City NeighborhoodEstimated Value: $1,145,000 - $1,327,000
3
Beds
2
Baths
1,812
Sq Ft
$677/Sq Ft
Est. Value
About This Home
This home is located at 48-26 38 Th St, New York City, NY 11101 and is currently estimated at $1,225,825, approximately $676 per square foot. 48-26 38 Th St is a home located in Queens County with nearby schools including P.S. 199 Maurice A Fitzgerald, Long Island City High School, and Most Precious Blood Roman Catholic Church.
Ownership History
Date
Name
Owned For
Owner Type
Purchase Details
Closed on
Nov 21, 2024
Sold by
Fan Tsang Elsa Pui
Bought by
Anwar Abid and Kaur Chamandeep
Current Estimated Value
Home Financials for this Owner
Home Financials are based on the most recent Mortgage that was taken out on this home.
Original Mortgage
$630,500
Outstanding Balance
$624,322
Interest Rate
6.72%
Mortgage Type
Purchase Money Mortgage
Estimated Equity
$601,503
Purchase Details
Closed on
Nov 12, 2018
Sold by
Elkordy Mohamed and Elkordy Nagwa
Bought by
Tsang Elsa Pui Fan
Purchase Details
Closed on
Jun 21, 2012
Sold by
Johmann Elise M
Bought by
Elkordy Mohamed and Elkordy Nagwa
Home Financials for this Owner
Home Financials are based on the most recent Mortgage that was taken out on this home.
Original Mortgage
$404,000
Interest Rate
3.78%
Mortgage Type
New Conventional
Create a Home Valuation Report for This Property
The Home Valuation Report is an in-depth analysis detailing your home's value as well as a comparison with similar homes in the area
Home Values in the Area
Average Home Value in this Area
Purchase History
| Date | Buyer | Sale Price | Title Company |
|---|---|---|---|
| Anwar Abid | $1,261,000 | -- | |
| Tsang Elsa Pui Fan | $975,000 | -- | |
| Tsang Elsa Pui Fan | $975,000 | -- | |
| Elkordy Mohamed | $509,000 | -- | |
| Elkordy Mohamed | $509,000 | -- |
Source: Public Records
Mortgage History
| Date | Status | Borrower | Loan Amount |
|---|---|---|---|
| Open | Anwar Abid | $630,500 | |
| Previous Owner | Elkordy Mohamed | $404,000 |
Source: Public Records
Tax History Compared to Growth
Tax History
| Year | Tax Paid | Tax Assessment Tax Assessment Total Assessment is a certain percentage of the fair market value that is determined by local assessors to be the total taxable value of land and additions on the property. | Land | Improvement |
|---|---|---|---|---|
| 2025 | $8,603 | $44,580 | $5,303 | $39,277 |
| 2024 | $8,603 | $42,833 | $4,948 | $37,885 |
| 2023 | $8,146 | $40,556 | $4,601 | $35,955 |
| 2022 | $7,668 | $63,960 | $8,400 | $55,560 |
| 2021 | $8,083 | $60,420 | $8,400 | $52,020 |
| 2020 | $7,409 | $58,080 | $8,400 | $49,680 |
| 2019 | $7,018 | $53,100 | $8,400 | $44,700 |
Source: Public Records
Map
Nearby Homes
- 0 39th St
- 48-12 37th St
- 48-21 40th St Unit 2C
- 48-21 40th St Unit 5H
- 4827 40th St
- 3617 Greenpoint Ave
- 5024 39th Place
- 50-21 39th Place Unit 2C
- 50-21 39th Place Unit 6D
- 50-22 40th St Unit 3E
- 50-22 40th St Unit 5A
- 50-35 38th St
- 47-25 40th St Unit 2C
- 50-29 39th Place
- 50-43 39th St
- 50-21 40th St
- 5054 39th Place
- 48-23 42nd St Unit 1 J
- 48-01 42nd St Unit 5D
- 48-17 42nd St Unit 2C