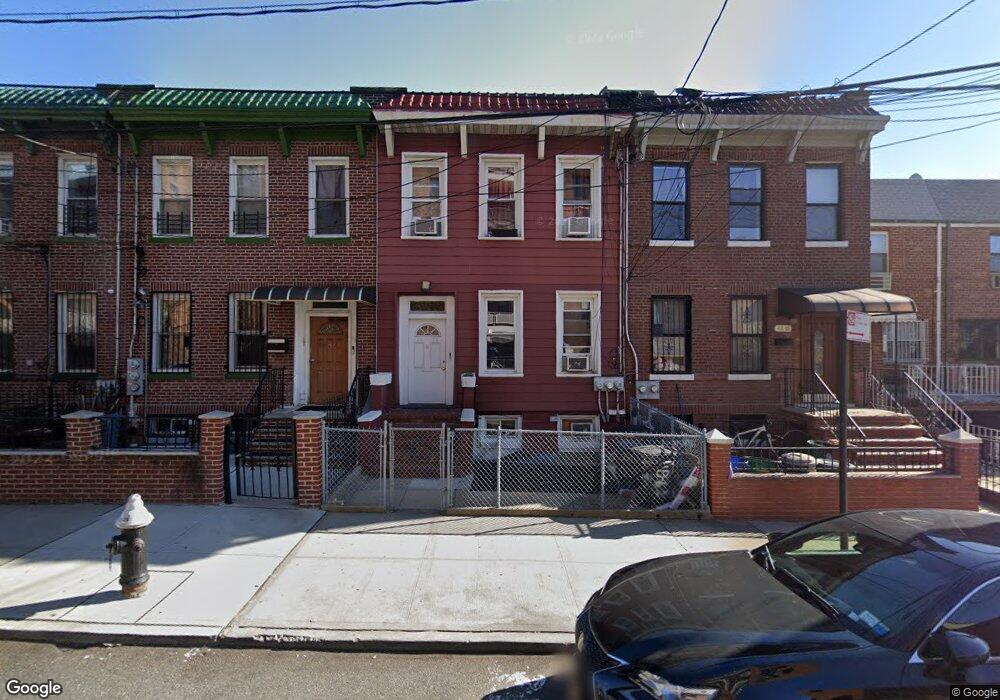
48-63 37th St Unit 2nd fl Long Island City, NY 11101
Long Island City NeighborhoodEstimated Value: $1,419,000 - $1,926,000
4
Beds
1
Bath
1,926
Sq Ft
$854/Sq Ft
Est. Value
About This Home
This home is located at 48-63 37th St Unit 2nd fl, Long Island City, NY 11101 and is currently estimated at $1,644,667, approximately $853 per square foot. 48-63 37th St Unit 2nd fl is a home located in Queens County with nearby schools including P.S. 199 Maurice A Fitzgerald and Long Island City High School.
Ownership History
Date
Name
Owned For
Owner Type
Purchase Details
Closed on
Jul 31, 2024
Sold by
Calle Victor D and Montufar Edison D
Bought by
Montufar Edison D
Current Estimated Value
Purchase Details
Closed on
Dec 11, 2017
Sold by
Calle Gloria and Calle Victor
Bought by
Calle Victor and Montufar Edison D
Purchase Details
Closed on
Jan 19, 2017
Sold by
Calle Gloria and Calle Victor
Bought by
Calle Gloria and Calle Victor
Purchase Details
Closed on
Sep 13, 1995
Sold by
Corona & Ny Enterprises Inc
Bought by
Calle Gloria and Calle Victor
Home Financials for this Owner
Home Financials are based on the most recent Mortgage that was taken out on this home.
Original Mortgage
$229,500
Interest Rate
7.86%
Purchase Details
Closed on
Jul 19, 1995
Sold by
Citibank Na
Bought by
Corona & Ny Enterprises Inc
Home Financials for this Owner
Home Financials are based on the most recent Mortgage that was taken out on this home.
Original Mortgage
$229,500
Interest Rate
7.86%
Create a Home Valuation Report for This Property
The Home Valuation Report is an in-depth analysis detailing your home's value as well as a comparison with similar homes in the area
Home Values in the Area
Average Home Value in this Area
Purchase History
| Date | Buyer | Sale Price | Title Company |
|---|---|---|---|
| Montufar Edison D | -- | -- | |
| Calle Victor | -- | -- | |
| Calle Victor | -- | -- | |
| Calle Gloria | -- | -- | |
| Calle Gloria | -- | -- | |
| Calle Gloria | $255,000 | Commonwealth Land Title Ins | |
| Calle Gloria | $255,000 | Commonwealth Land Title Ins | |
| Corona & Ny Enterprises Inc | $158,000 | -- | |
| Corona & Ny Enterprises Inc | $158,000 | -- |
Source: Public Records
Mortgage History
| Date | Status | Borrower | Loan Amount |
|---|---|---|---|
| Previous Owner | Calle Gloria | $229,500 | |
| Previous Owner | Corona & Ny Enterprises Inc | $140,000 |
Source: Public Records
Tax History Compared to Growth
Tax History
| Year | Tax Paid | Tax Assessment Tax Assessment Total Assessment is a certain percentage of the fair market value that is determined by local assessors to be the total taxable value of land and additions on the property. | Land | Improvement |
|---|---|---|---|---|
| 2025 | $8,722 | $45,308 | $5,954 | $39,354 |
| 2024 | $8,722 | $43,424 | $6,188 | $37,236 |
| 2023 | $8,290 | $41,274 | $5,127 | $36,147 |
| 2022 | $7,810 | $72,000 | $10,620 | $61,380 |
| 2021 | $7,946 | $62,880 | $10,620 | $52,260 |
| 2020 | $7,992 | $56,100 | $10,620 | $45,480 |
| 2019 | $7,570 | $51,480 | $10,620 | $40,860 |
| 2018 | $7,011 | $34,395 | $6,368 | $28,027 |
| 2017 | $6,646 | $32,602 | $6,725 | $25,877 |
| 2016 | $6,290 | $32,602 | $6,725 | $25,877 |
| 2015 | $3,710 | $31,464 | $9,115 | $22,349 |
| 2014 | $3,710 | $30,156 | $10,477 | $19,679 |
Source: Public Records
Map
Nearby Homes
- 48-12 37th St
- 3617 Greenpoint Ave
- 0 39th St
- 50-35 38th St
- 5024 39th Place
- 50-43 39th St
- 50-21 39th Place Unit 2C
- 50-21 39th Place Unit 6D
- 50-29 39th Place
- 50-22 40th St Unit 3E
- 50-22 40th St Unit 5A
- 48-21 40th St Unit 2C
- 48-21 40th St Unit 5H
- 4827 40th St
- 5054 39th Place
- 50-21 40th St
- 47-25 40th St Unit 2C
- 4538 40th St
- 5130 35th St
- 48-23 42nd St Unit 1 J
- 4863 37th St
- 4865 37th St
- 4861 37th St
- 4867 37th St
- 4859 37th St
- 4869 37th St
- 4869 37th St
- 48-63 37 St Unit 2nd fl
- 4871 37th St
- 48-69 37 Th St
- 37-17 Greenpoint Ave Unit 1
- 37-17 Greenpoint Ave Unit 2
- 37-17 Greenpoint Ave
- 4860 38th St
- 4862 38th St
- 3719 Greenpoint Ave
- 4858 38th St
- 37-21 Greenpoint Ave Unit 3
- 3721 Greenpoint Ave