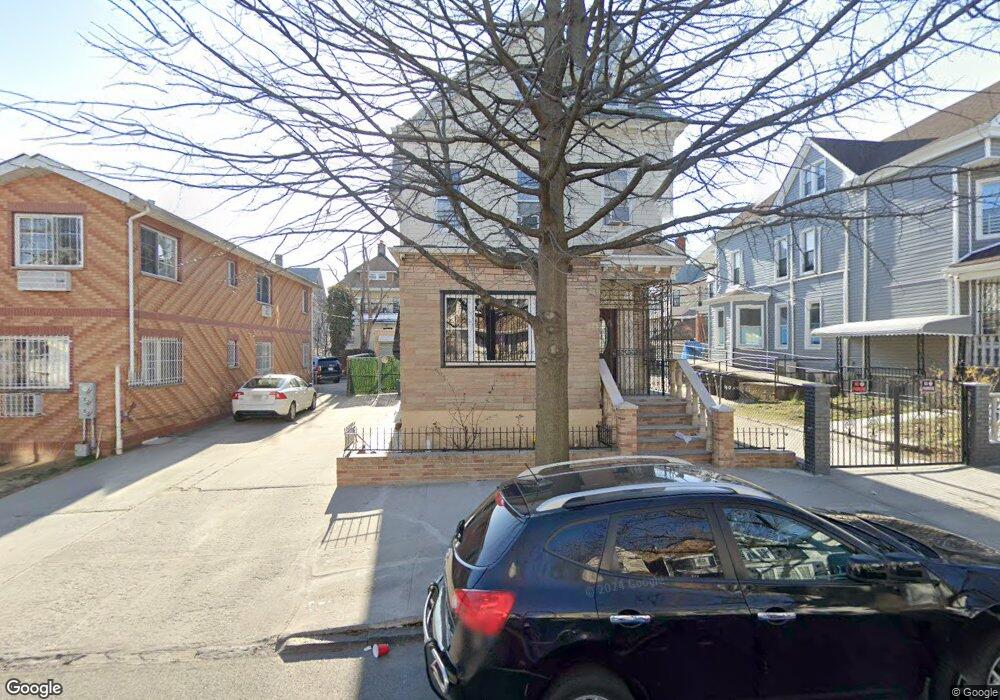
48 Ashford St Brooklyn, NY 11207
Cypress Hills NeighborhoodEstimated Value: $1,190,000 - $1,475,000
--
Bed
--
Bath
3,955
Sq Ft
$330/Sq Ft
Est. Value
About This Home
This home is located at 48 Ashford St, Brooklyn, NY 11207 and is currently estimated at $1,303,270, approximately $329 per square foot. 48 Ashford St is a home located in Kings County with nearby schools including P.S. 108 - Sal Abbracciamento, Liberty Avenue Middle School, and Vista Academy.
Ownership History
Date
Name
Owned For
Owner Type
Purchase Details
Closed on
Jun 11, 2001
Sold by
Rodriguez Jose M
Bought by
Rodriguez Jose R
Current Estimated Value
Home Financials for this Owner
Home Financials are based on the most recent Mortgage that was taken out on this home.
Original Mortgage
$100,000
Outstanding Balance
$38,259
Interest Rate
7.2%
Estimated Equity
$1,265,011
Create a Home Valuation Report for This Property
The Home Valuation Report is an in-depth analysis detailing your home's value as well as a comparison with similar homes in the area
Home Values in the Area
Average Home Value in this Area
Purchase History
| Date | Buyer | Sale Price | Title Company |
|---|---|---|---|
| Rodriguez Jose R | -- | -- |
Source: Public Records
Mortgage History
| Date | Status | Borrower | Loan Amount |
|---|---|---|---|
| Open | Rodriguez Jose R | $100,000 |
Source: Public Records
Tax History Compared to Growth
Tax History
| Year | Tax Paid | Tax Assessment Tax Assessment Total Assessment is a certain percentage of the fair market value that is determined by local assessors to be the total taxable value of land and additions on the property. | Land | Improvement |
|---|---|---|---|---|
| 2025 | $7,786 | $85,680 | $22,140 | $63,540 |
| 2024 | $7,786 | $87,540 | $22,140 | $65,400 |
| 2023 | $7,429 | $83,820 | $22,140 | $61,680 |
| 2022 | $6,895 | $91,860 | $22,140 | $69,720 |
| 2021 | $6,861 | $72,960 | $22,140 | $50,820 |
| 2020 | $5,146 | $60,960 | $22,140 | $38,820 |
| 2019 | $6,758 | $48,480 | $22,140 | $26,340 |
| 2018 | $6,214 | $30,484 | $15,058 | $15,426 |
| 2017 | $5,867 | $28,782 | $13,739 | $15,043 |
| 2016 | $5,431 | $27,169 | $16,543 | $10,626 |
| 2015 | $3,055 | $27,169 | $17,059 | $10,110 |
| 2014 | $3,055 | $26,922 | $17,087 | $9,835 |
Source: Public Records
Map
Nearby Homes
- 432 Jamaica Ave
- 33 Jerome St
- 117 Cleveland St
- 54 Elton St
- 171 Arlington Ave
- 168 Warwick St
- 3 Schenck Ct
- 126 Jerome St
- 120 Essex St
- 87 Schenck Ave
- 2880 Fulton St
- 33 Essex St
- 147 Essex St
- 133 Sunnyside Ave
- 324 Arlington Ave
- 206 Elton St
- 14 van Siclen Ct
- 153 Hendrix St
- 221 Barbey St
- 224 Highland Blvd Unit 710
- 40 Ashford St
- 40 Ashford St Unit 2
- 52 Ashford St
- 36 Ashford St
- 58 Ashford St
- 105 Warwick St
- 109 Warwick St
- 101 Warwick St
- 60 Ashford St
- 115 Warwick St
- 115 Warwick St Unit Building
- 28 Ashford St
- 97 Warwick St
- 117 Warwick St
- 64 Ashford St
- 45 Ashford St
- 49 Ashford St
- 43 Ashford St
- 43 Ashford St Unit 1A
- 51 Ashford St