
Seller's Agent in 2017
Jim McGue
GRANITE GROUP REALTORS®
(617) 694-5756
72 Total Sales

Estimated Value: $643,501 - $947,000
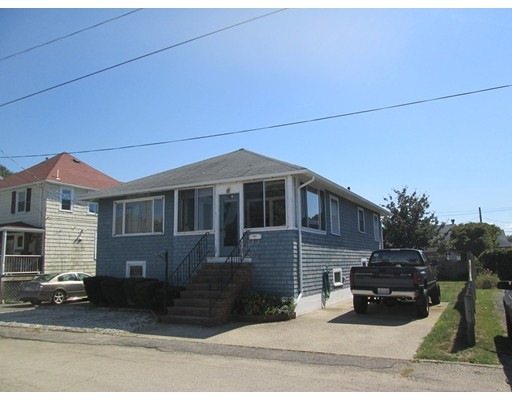
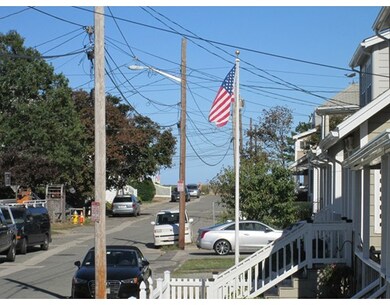
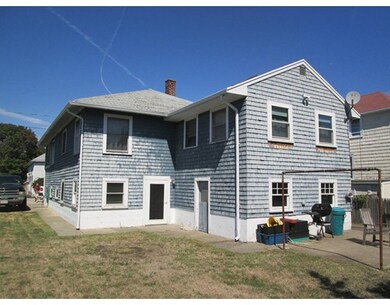
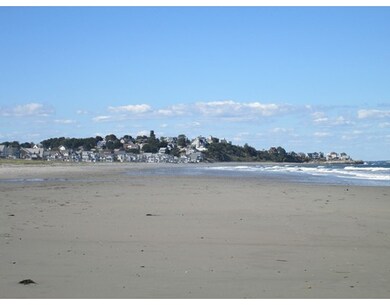
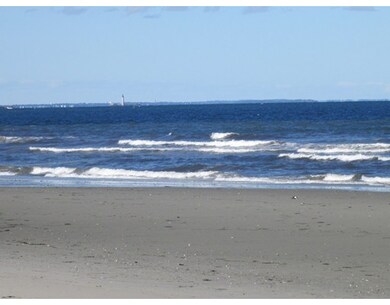
Beach side Bungalow ready for new energy and updating. The location of this home with ocean & bay influence - will motivate you daily. Beautiful sandy shoreline just a 5 minute walk from your door. You will enjoy beach activities all year round. Picturesque sunsets from the 3 season porch.
Home Type
Single Family
Year Built
1920
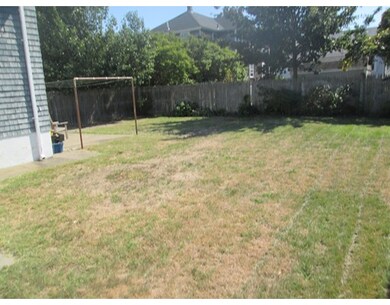
Lot Details
0
| Date | Buyer | Sale Price | Title Company |
|---|---|---|---|
| Horne Louise R | $272,000 | -- |
| Date | Status | Borrower | Loan Amount |
|---|---|---|---|
| Open | Horne Louise R | $50,000 | |
| Open | Horne Louise R | $335,000 | |
| Closed | Horne Louise R | $306,000 | |
| Closed | Horne Louise R | $217,600 |
| Date | Event | Price | List to Sale | Price per Sq Ft |
|---|---|---|---|---|
| 01/24/2017 01/24/17 | Sold | $275,000 | -11.3% | $217 / Sq Ft |
| 11/21/2016 11/21/16 | Pending | -- | -- | -- |
| 10/18/2016 10/18/16 | Price Changed | $309,900 | -4.6% | $245 / Sq Ft |
| 09/15/2016 09/15/16 | For Sale | $325,000 | -- | $257 / Sq Ft |
| Year | Tax Paid | Tax Assessment Tax Assessment Total Assessment is a certain percentage of the fair market value that is determined by local assessors to be the total taxable value of land and additions on the property. | Land | Improvement |
|---|---|---|---|---|
| 2025 | $6,281 | $560,800 | $340,400 | $220,400 |
| 2024 | $5,403 | $463,800 | $314,200 | $149,600 |
| 2023 | $4,861 | $399,400 | $261,800 | $137,600 |
| 2022 | $4,755 | $379,200 | $248,700 | $130,500 |
| 2021 | $3,962 | $377,700 | $248,700 | $129,000 |
| 2020 | $6,081 | $386,700 | $248,700 | $138,000 |
| 2019 | $4,651 | $356,400 | $222,600 | $133,800 |
| 2018 | $3,239 | $339,300 | $222,600 | $116,700 |
| 2017 | $4,539 | $330,800 | $222,600 | $108,200 |
| 2016 | $4,459 | $330,800 | $222,600 | $108,200 |
| 2015 | $4,248 | $304,700 | $196,400 | $108,300 |
| 2014 | $4,226 | $304,700 | $196,400 | $108,300 |
Seller's Agent in 2017
Jim McGue
GRANITE GROUP REALTORS®
(617) 694-5756
72 Total Sales
Source: MLS Property Information Network (MLS PIN)
MLS Number: 72068333
APN: HULL-000017-000000-000027
Disclaimer: Certain information contained herein is derived from information provided by parties other than Homes.com. All information provided is deemed reliable, but is not guaranteed to be accurate and should be independently verified.
![]() The property listing data and information, or the Images, set forth herein were provided to MLS Property Information Network, Inc. from third party sources, including sellers, lessors and public records, and were compiled by MLS Property Information Network, Inc. The property listing data and information, and the Images, are for the personal, non-commercial use of consumers having a good faith interest in purchasing or leasing listed properties of the type displayed to them and may not be used for any purpose other than to identify prospective properties which such consumers may have a good faith interest in purchasing or leasing. MLS Property Information Network, Inc. and its subscribers disclaim any and all representations and warranties as to the accuracy of the property listing data and information, or as to the accuracy of any of the Images, set forth herein.
The property listing data and information, or the Images, set forth herein were provided to MLS Property Information Network, Inc. from third party sources, including sellers, lessors and public records, and were compiled by MLS Property Information Network, Inc. The property listing data and information, and the Images, are for the personal, non-commercial use of consumers having a good faith interest in purchasing or leasing listed properties of the type displayed to them and may not be used for any purpose other than to identify prospective properties which such consumers may have a good faith interest in purchasing or leasing. MLS Property Information Network, Inc. and its subscribers disclaim any and all representations and warranties as to the accuracy of the property listing data and information, or as to the accuracy of any of the Images, set forth herein.