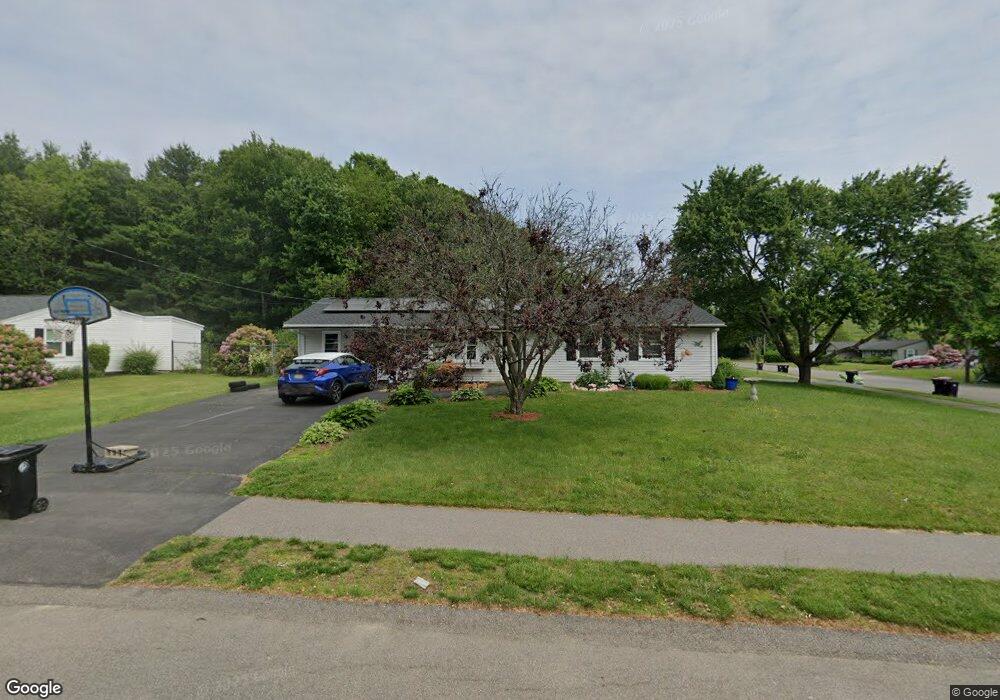
48 Backlund Dr Brockton, MA 02302
Estimated Value: $476,000 - $494,025
3
Beds
1
Bath
1,324
Sq Ft
$367/Sq Ft
Est. Value
About This Home
This home is located at 48 Backlund Dr, Brockton, MA 02302 and is currently estimated at $486,256, approximately $367 per square foot. 48 Backlund Dr is a home located in Plymouth County with nearby schools including Davis K-8 School, John F. Kennedy Elementary School, and South Middle School.
Ownership History
Date
Name
Owned For
Owner Type
Purchase Details
Closed on
Jul 20, 2007
Sold by
Minden Elliot H
Bought by
Bigness Raymond and Bigness Terri-Lynn A
Current Estimated Value
Home Financials for this Owner
Home Financials are based on the most recent Mortgage that was taken out on this home.
Original Mortgage
$226,446
Interest Rate
6.54%
Mortgage Type
Purchase Money Mortgage
Create a Home Valuation Report for This Property
The Home Valuation Report is an in-depth analysis detailing your home's value as well as a comparison with similar homes in the area
Home Values in the Area
Average Home Value in this Area
Purchase History
| Date | Buyer | Sale Price | Title Company |
|---|---|---|---|
| Bigness Raymond | $230,000 | -- |
Source: Public Records
Mortgage History
| Date | Status | Borrower | Loan Amount |
|---|---|---|---|
| Open | Bigness Raymond | $229,842 | |
| Closed | Bigness Raymond | $226,446 | |
| Previous Owner | Bigness Raymond | $75,000 |
Source: Public Records
Tax History Compared to Growth
Tax History
| Year | Tax Paid | Tax Assessment Tax Assessment Total Assessment is a certain percentage of the fair market value that is determined by local assessors to be the total taxable value of land and additions on the property. | Land | Improvement |
|---|---|---|---|---|
| 2025 | $4,774 | $394,200 | $161,100 | $233,100 |
| 2024 | $4,589 | $381,800 | $161,100 | $220,700 |
| 2023 | $4,437 | $341,800 | $111,400 | $230,400 |
| 2022 | $4,114 | $294,500 | $101,200 | $193,300 |
| 2021 | $4,014 | $276,800 | $94,300 | $182,500 |
| 2020 | $4,025 | $265,700 | $82,600 | $183,100 |
| 2019 | $3,548 | $228,300 | $79,000 | $149,300 |
| 2018 | $3,496 | $217,700 | $79,000 | $138,700 |
| 2017 | $2,925 | $181,700 | $79,000 | $102,700 |
| 2016 | $3,182 | $183,300 | $75,300 | $108,000 |
| 2015 | $2,953 | $162,700 | $75,300 | $87,400 |
| 2014 | $2,926 | $161,400 | $75,300 | $86,100 |
Source: Public Records
Map
Nearby Homes