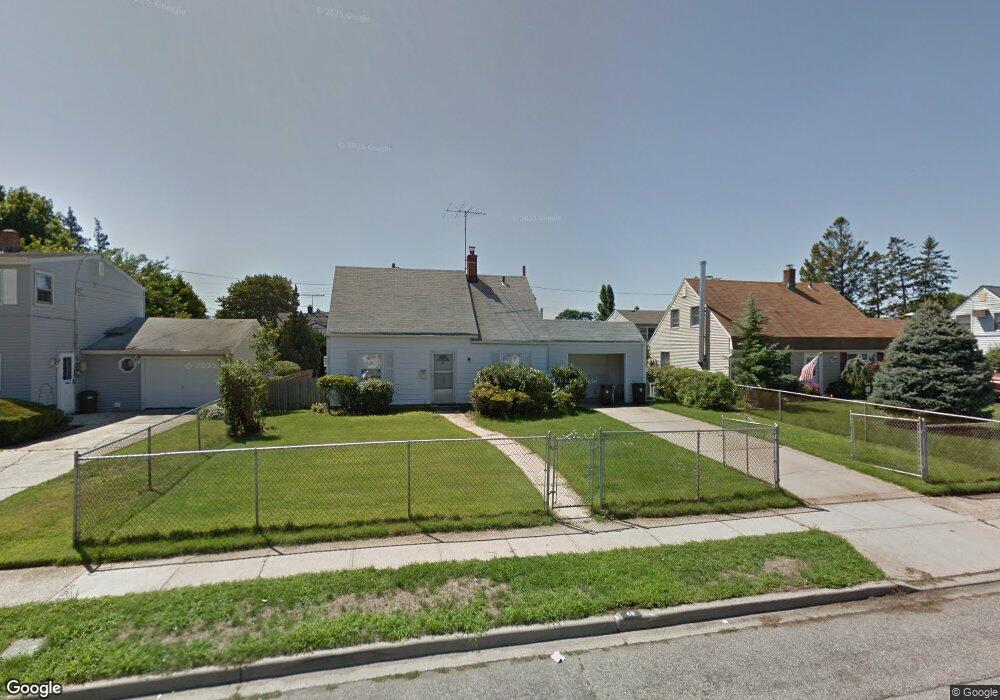
48 Balsam Ln Levittown, NY 11756
Estimated Value: $567,000 - $682,393
3
Beds
1
Bath
1,050
Sq Ft
$595/Sq Ft
Est. Value
About This Home
This home is located at 48 Balsam Ln, Levittown, NY 11756 and is currently estimated at $624,697, approximately $594 per square foot. 48 Balsam Ln is a home located in Nassau County with nearby schools including Abbey Lane Elementary School, Wisdom Lane Middle School, and Division Avenue Senior High School.
Ownership History
Date
Name
Owned For
Owner Type
Purchase Details
Closed on
Nov 7, 2017
Sold by
Porter Candice and Porter Dwayne
Bought by
Galizia Lauren
Current Estimated Value
Purchase Details
Closed on
Jun 16, 2009
Sold by
Schaeffer Beatrice
Bought by
Porter Dwayne and Braband Candice J
Home Financials for this Owner
Home Financials are based on the most recent Mortgage that was taken out on this home.
Original Mortgage
$260,200
Interest Rate
4.86%
Mortgage Type
Purchase Money Mortgage
Create a Home Valuation Report for This Property
The Home Valuation Report is an in-depth analysis detailing your home's value as well as a comparison with similar homes in the area
Home Values in the Area
Average Home Value in this Area
Purchase History
| Date | Buyer | Sale Price | Title Company |
|---|---|---|---|
| Galizia Lauren | $335,000 | Amtrust Title | |
| Porter Dwayne | $265,500 | -- |
Source: Public Records
Mortgage History
| Date | Status | Borrower | Loan Amount |
|---|---|---|---|
| Previous Owner | Porter Dwayne | $260,200 |
Source: Public Records
Tax History Compared to Growth
Tax History
| Year | Tax Paid | Tax Assessment Tax Assessment Total Assessment is a certain percentage of the fair market value that is determined by local assessors to be the total taxable value of land and additions on the property. | Land | Improvement |
|---|---|---|---|---|
| 2025 | $11,856 | $362 | $205 | $157 |
| 2024 | $2,988 | $358 | $203 | $155 |
| 2023 | $11,769 | $370 | $210 | $160 |
| 2022 | $11,769 | $372 | $211 | $161 |
| 2021 | $16,527 | $370 | $210 | $160 |
| 2020 | $22,410 | $611 | $552 | $59 |
| 2019 | $3,372 | $611 | $552 | $59 |
| 2018 | $7,303 | $611 | $0 | $0 |
| 2017 | $6,423 | $611 | $552 | $59 |
| 2016 | $9,526 | $611 | $552 | $59 |
| 2015 | $2,862 | $611 | $552 | $59 |
| 2014 | $2,862 | $611 | $552 | $59 |
| 2013 | $2,632 | $611 | $552 | $59 |
Source: Public Records
Map
Nearby Homes