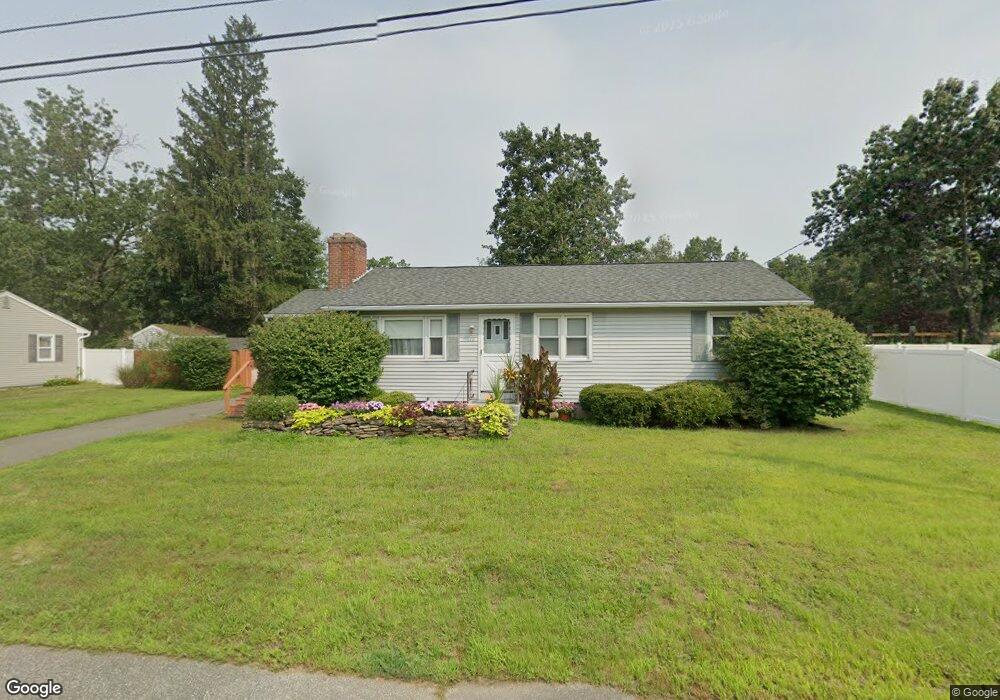
48 Barna St Ludlow, MA 01056
Estimated Value: $275,704 - $332,000
3
Beds
1
Bath
1,158
Sq Ft
$261/Sq Ft
Est. Value
About This Home
This home is located at 48 Barna St, Ludlow, MA 01056 and is currently estimated at $301,926, approximately $260 per square foot. 48 Barna St is a home located in Hampden County with nearby schools including East Street Elementary School, Chapin Street Elementary School, and Paul R. Baird Middle School.
Ownership History
Date
Name
Owned For
Owner Type
Purchase Details
Closed on
Nov 21, 2005
Sold by
Shirely Madeline
Bought by
Shirely Michael T
Current Estimated Value
Home Financials for this Owner
Home Financials are based on the most recent Mortgage that was taken out on this home.
Original Mortgage
$158,332
Outstanding Balance
$86,395
Interest Rate
6.07%
Mortgage Type
VA
Estimated Equity
$215,531
Purchase Details
Closed on
Jul 31, 1998
Sold by
Cardinale Dominick L and Nedeau Patricia L
Bought by
Shirley Madeline
Create a Home Valuation Report for This Property
The Home Valuation Report is an in-depth analysis detailing your home's value as well as a comparison with similar homes in the area
Home Values in the Area
Average Home Value in this Area
Purchase History
| Date | Buyer | Sale Price | Title Company |
|---|---|---|---|
| Shirely Michael T | $155,000 | -- | |
| Shirely Michael T | $155,000 | -- | |
| Shirley Madeline | $101,500 | -- | |
| Shirley Madeline | $101,500 | -- |
Source: Public Records
Mortgage History
| Date | Status | Borrower | Loan Amount |
|---|---|---|---|
| Open | Shirely Michael T | $158,332 | |
| Closed | Shirley Madeline | $158,332 |
Source: Public Records
Tax History Compared to Growth
Tax History
| Year | Tax Paid | Tax Assessment Tax Assessment Total Assessment is a certain percentage of the fair market value that is determined by local assessors to be the total taxable value of land and additions on the property. | Land | Improvement |
|---|---|---|---|---|
| 2025 | $3,987 | $229,800 | $72,600 | $157,200 |
| 2024 | $3,777 | $208,800 | $72,600 | $136,200 |
| 2023 | $3,553 | $182,100 | $63,700 | $118,400 |
| 2022 | $3,382 | $169,200 | $63,700 | $105,500 |
| 2021 | $3,396 | $161,100 | $63,700 | $97,400 |
| 2020 | $3,256 | $157,900 | $62,800 | $95,100 |
| 2019 | $3,027 | $152,700 | $62,200 | $90,500 |
| 2018 | $2,836 | $149,200 | $62,200 | $87,000 |
| 2017 | $2,768 | $149,400 | $60,300 | $89,100 |
| 2016 | $2,629 | $145,000 | $59,100 | $85,900 |
| 2015 | $2,490 | $144,000 | $58,500 | $85,500 |
Source: Public Records
Map
Nearby Homes
- 251 West St
- 319 West St
- 3 Fontaine St
- 482 Holyoke St
- 350 West St Unit 19
- 436 Holyoke St
- 41 Deroche Cir
- 42 Roy St
- 61 Massachusetts Ave
- 1133 Burnett Rd
- 33 Grimard St
- 1130 Burnett Rd
- 166 Kendall St
- 58 Mariana Ln
- 32 Mockingbird Dr
- 26 Lark Dr
- 7 Finch Dr
- 166-168 Main St
- 98 Fuller St Unit 32
- 84 Fuller St Unit 1